
Saved Queries and Historical Queries
The Query page includes fields for re-using queries:
Load from Query Library. Leads to a list of saved queries. Saved queries are associated with your login. You can view saved queries you create and those shared with you by other users.
Load from Historical Query. Leads to a list of cached queries. Query history is not associated with your login but instead includes all queries from all Lucidum users on the current Lucidum system. Query history is deleted when the Lucidum system is rebooted or restarted.
This chapter describes how to create, use, and manage saved queries and historical queries.
Creating a Saved Query
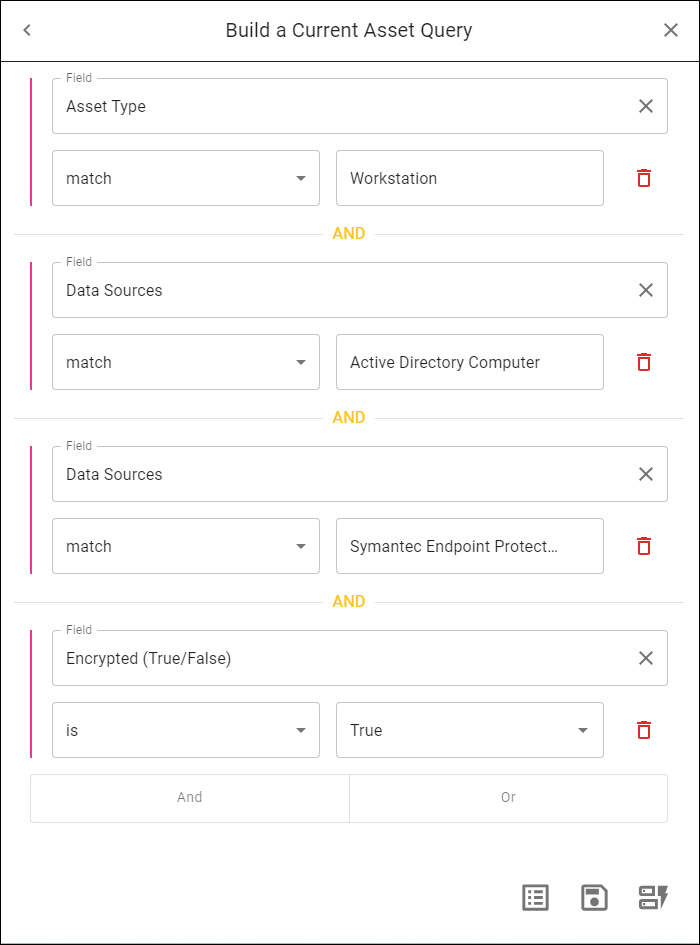
From the Query button, you can save a query for use in a chart, a Smart Label, or an Action. To do this:
Follow the steps to Create a query.
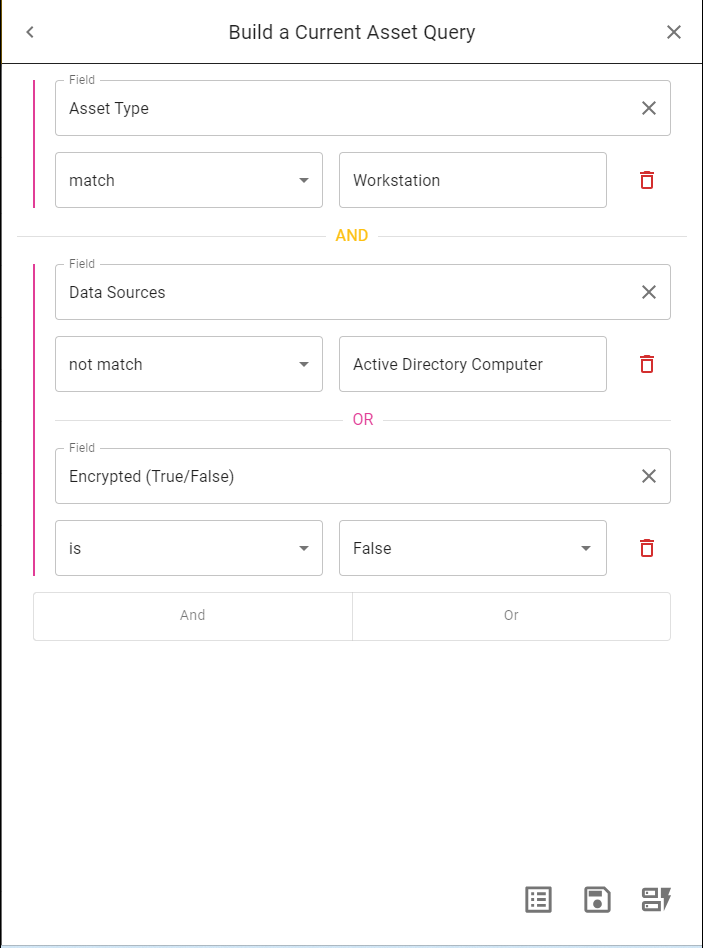
In the Query a Current page, click the Save Query (disc).
The Save Query dialog page appears:
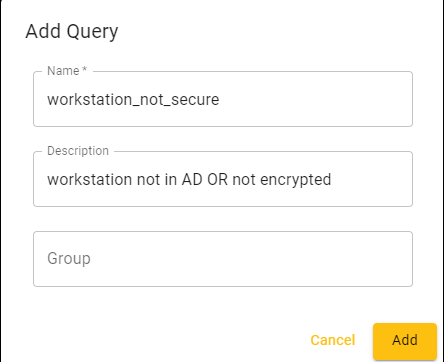
In the Save Query dialog page, supply values in the fields:
Query Name. The name of the saved query.
Description. Optional description of the query.
Group. Optional group to organized saved queries.
The saved query now appears in the list of Saved Queries in the Query page and in the Query Library page (Settings > Query Library).
Using a Saved Query
You can use a Saved Query from the Query page.
From the Query button, you can load a saved query for use in a chart, an action, or a Smart Label:
Click the Query button in the upper right corner of each page in Lucidum.
The Query page appears.
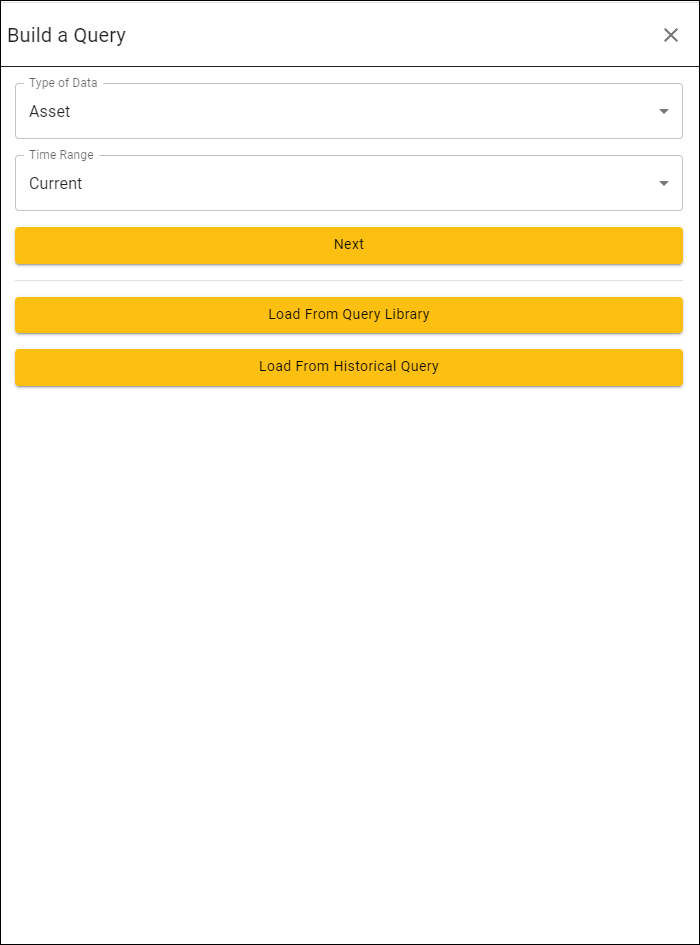
In the Query page, click Load from Query Library.
The Choose a Save Query page appears, with a list of all saved queries.
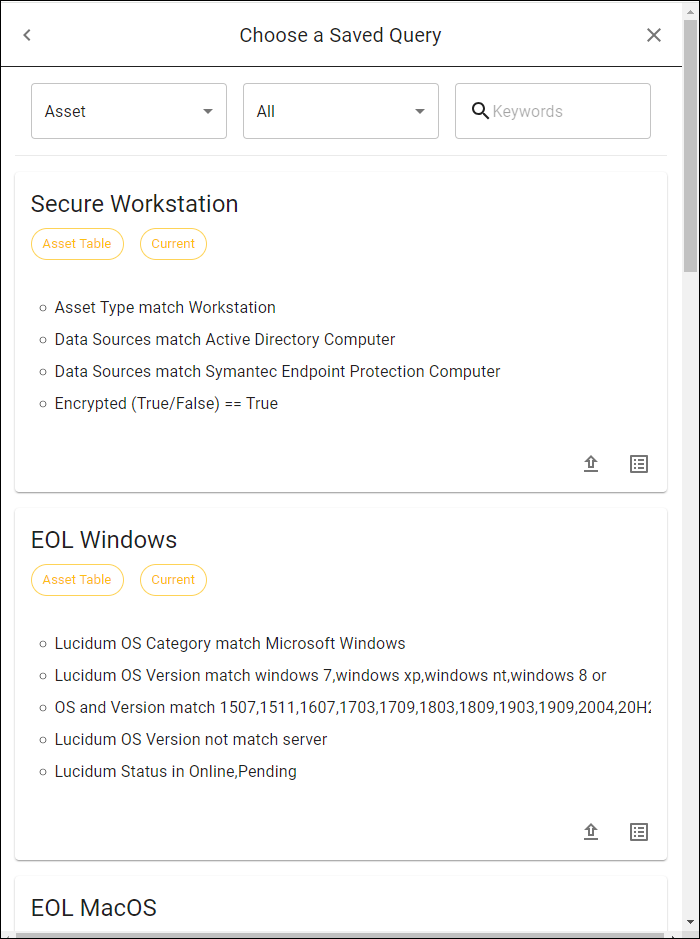
To choose and load a query, select the Edit Saved Query (up arrow) icon.
The query appears in the Build a Query page. From this page, you can edit the saved query or apply it to a chart or action.
To apply the saved query to a chart or action, click the Apply (pencil and paper) icon.
Managing Saved Queries
You can manage saved queries in the Query Library page (Settings > Query Library). From the Query Library page, you can:
edit the properties of the saved query
edit the filter for the saved query
use the saved query to build an action
delete the saved query
export a saved query
import a saved query
To access the Query Library page:
Go to Settings > Query Library.
The Query Library page displays all the saved queries in Lucidum:

The Query Library page displays the following about each saved query:
Query Name. Name of the query.
Description. Description of the query.
Group. Category for the query. This is defined when the saved query is created and helps keep the queries organized.
You can perform the following actions on each saved query:
Edit Properties for Saved Query (pencil icon). Leads to the Edit Saved Query modal, where you can edit the name, description, and group for a saved query.
Edit Filter for Save Query (up-arrow icon). Leads to the Edit Filters for Saved Query, where you can edit the filter for the query.
Send Save Query to Action Center (paper airplane icon). Leads to the Actions page, where you can create an action with the saved query loaded in the action definition.
Delete a Saved Query (trash-can icon). Allows you to delete a saved query.
To export a query from the Query Library page, select Export. The query is saved as a JSON file to the local computer.
To import a query into the Query Library page, click the checkbox for the query, select Import and navigate to a saved JSON file.
To share a saved query with another Lucidum user, click the checkbox for the query and then select Share (email icon) in the lower left. The query will appear in the Query Library page for that user.
Historical Query
If you would like to re-run a query that you ran earlier but did not save as a Saved Query (query), you can use the Historical Query (query). Historical Queries are not associated with your login but instead includes all queries from all Lucidum users on the current Lucidum system. Historical Queries are deleted when the Lucidum system is rebooted or restarted.
To load a historical query for use in a chart, a Smart Label, or other parts of Lucidum:
From the Query button, you can load a historical query for use in a chart, an action, or a Smart Label:
Click the Query button in the upper right corner of each page in Lucidum.
The Query page appears.
In the Query page, click Load from Historical Query.
The Choose a Historical Query page appears, with a list of all historical queries.
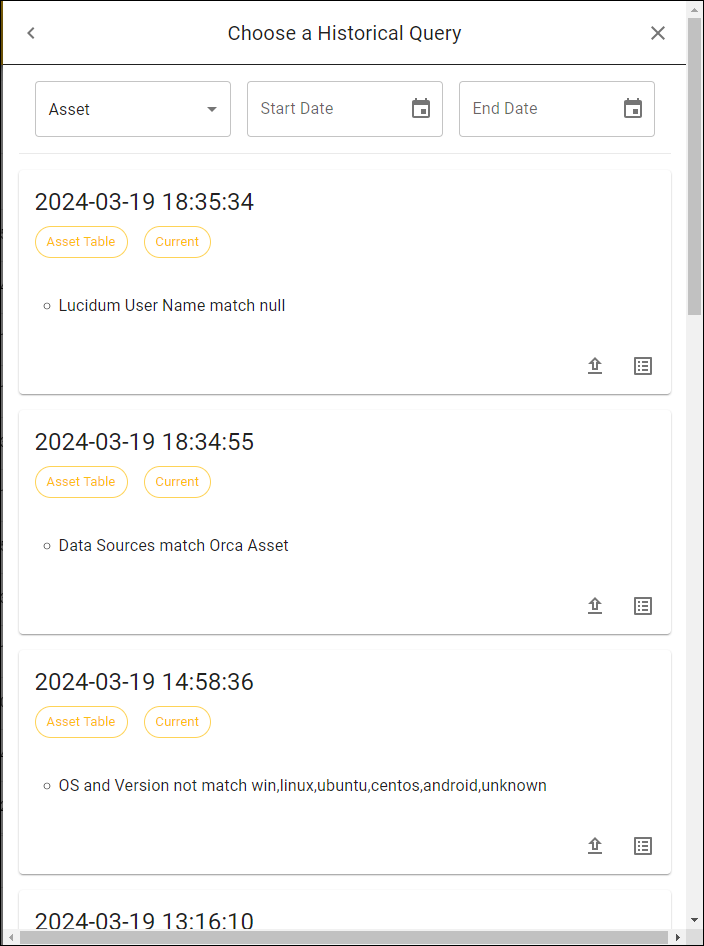
To choose and load a query, select the Edit Historical Query (up arrow) icon.
The query appears in the Query a Current page. From this page, you can edit the saved query or apply it to a chart or action.
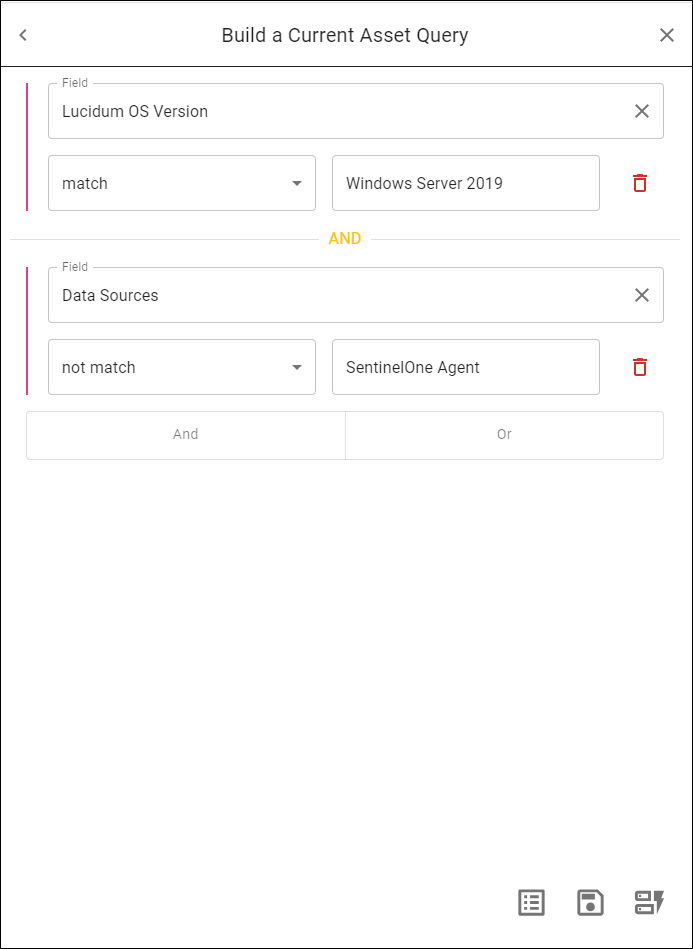
To apply the historical query to a chart or action, click the Apply (pencil and paper) icon.
Managing Historical Queries
You can manage previously run queries in the Query Run History page (Settings > Query Run History). From the Query Run History page, you can:
view the filter for the query
convert the query to a saved query
delete the query
To access the Query Run History page:
Go to Settings > Query Ru8n History.
The Query Run History page displays all the previously run queries in Lucidum:

The Query Run History page displays the following about each saved query:
Down arrow icon (v). Displays the query.
Table Name. Table associated with the query. Choices are:
Asset. Retrieve information about assets.
User. Retrieve information about users.
Vulnerability. Retrieve information about vulnerabilities.
Filters. Number of conditions in the query.
Query Time. Date and time the query was last run.
Result Count. Number of records that match the query on its last run.
You can perform the following actions on each previously run query:
Convert to Saved Query (disc icon). Leads to the Add Saved Query modal, where you can define a saved query.
Delete a Historical Query (trash-can icon). Allows you to delete a saved query.