
Building Queries
What Is a Query?
Queries and filters are methods to search the database in Lucidum to find data that meets your specifications. You can then include the results in charts, actions, and webhooks.
Queries include:
Type of Data. This is the top-level category for each query and specifies the type of Lucidum object you want to get information about. Choices are:
Asset. Retrieve information about assets.
User. Retrieve information about users.
Asset-IP Mapping. Lucidum uses proprietary machine-learning algorithms to align each asset with an IP address. You can retrieve information about these asset/IP pairs.
User-IP Mapping. Lucidum uses proprietary machine-learning algorithms to align each user with an IP address. You can retrieve information about these user/IP pairs.
Vulnerability. Retrieve information about vulnerabilities.
Time Range. You must first select whether you are interested in current values or historic values. The choices are:
Current. The default value is from the present day to 7 days old.
History. Older than current.
NOTE: You can customize or view the Time Range values in Settings > System Settings > Data Settings.
Current uses the value of Data Lookback in Days.
History uses the value of Data Retention in Days.
Operators. Operators define the relationship between the fields and the values. Operators can include “match”, “not match”, “is equal to”, “is not equal to”, “is greater than”, “is less than”, “exists”, “is empty”, among others. Lucidum provides a set of operators for each field. For details on operators, see the chapter on Data Types and Operators
Values. Values define the criteria for the specified fields. For example, if you chose “Memory Size (GB)” as a field, you could choose “is equal to” as an operator and “256” as a value. Your results would include only assets with 256 GB of memory.
Keywords. Lucidum queries support two keywords: AND and OR.
AND means that the results must meet all the criteria in a multi-part query.
OR means that the results must meet one of the criteria in a multi-part query
The Query Builder builds read-only (SELECT) queries.
To learn the basics of queries, you can read these articles. Although the Lucidum user interface does not require SQL syntax, these articles will help you understand how queries work.
https://www.w3schools.com/sql/sql_intro.asp
https://www.w3schools.com/sql/sql_select.asp
https://www.w3schools.com/sql/sql_and_or.asp
Viewing Your Data
Before creating queries, you might find it helpful to view the available data on your Lucidum system.
After ingesting raw data from multiple data sources, Lucidum deduplicates, triangulates, and aggregates the data to create enriched records for each asset and user.
To view a list of all assets, all users, and all vulnerabilities in your environment:
Go to Dashboards
In the left pane, go to the All Channels.
Search for the following dashboards:
Assets
Identities
Vulnerabilities
See details in Viewing Data About All Assets, All Users, and All Vulnerabilities.
Example Queries
The Value-Oriented Dashboards manual describes already-configured dashboards that you can use as-is or customize to fit your environment. You can also view working queries that you can customize to your needs.
Creating a Query
There are two ways to create a query:
From the button
From the Add Chart or Edit Chart page
Creating a Query from the Query Button
To create a query from the Query button: click the Query button in the upper right of any page in Lucidum.
Click the Query button in the upper right of any page in Lucidum.
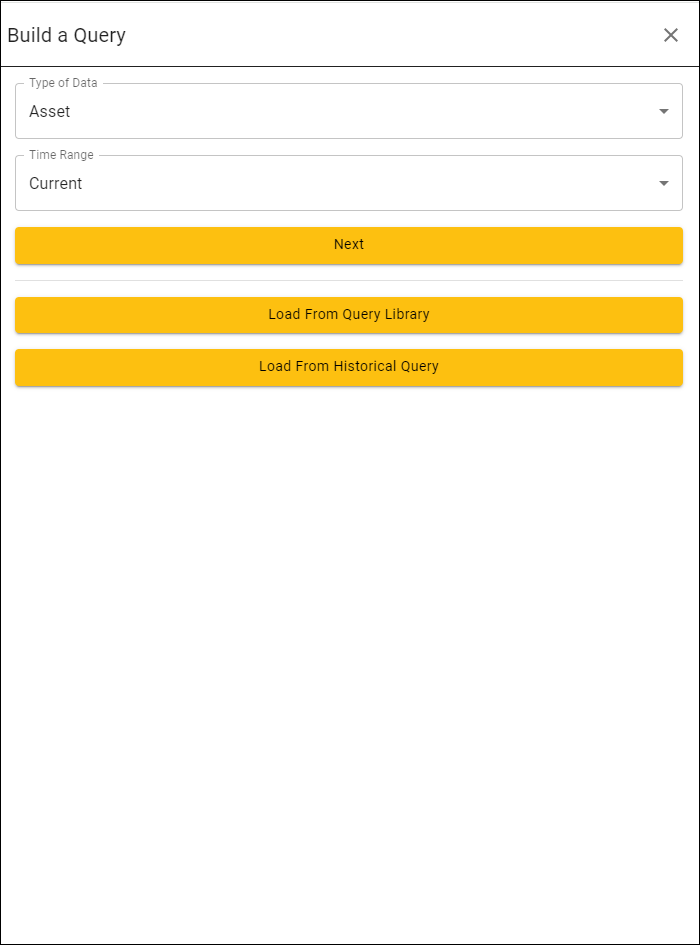
The Build a Query page appears. In the Build a Query page, define the following fields:
Type of Data. This is the top-level category for each query and specifies the type of Lucidum object you want to get information about. Choices are:
Asset. Retrieve information about assets.
Asset-IP Mapping. Lucidum uses proprietary machine-learning algorithms to align each asset with an IP address. You can retrieve information about these asset/IP pairs.
User. Retrieve information about users.
User-IP Mapping. Lucidum uses proprietary machine-learning algorithms to align each user with an IP address. You can retrieve information about these user/IP pairs.
Vulnerability. Retrieve information about vulnerabilities.
Time Range. You must first select whether you are interested in current values or historic values. The choices are:
Current. The default value is from the present day to 7 days old.
History. Older than current.
NOTE: You can customize or view the Time Range values in Settings > System Settings > Data Settings.
Current uses the value of Data Lookback in Days.
History uses the value of Data Retention in Days.
Fields. Fields are one or more properties that you are interested in, such as “first time seen”, “ip address”, “county code”, or “risk score”. Fields map to column names in a database table. For details on fields, see the chapter on Fields and Regular Expressions
In the Build a Query page, click the Next button. The Build a Current Asset Query page appears.
Follow the steps in the section Building the Query.
Creating a Query from the Add Chart or Edit Chart page
To create a query from the Add Chart page or the Edit Chart page:
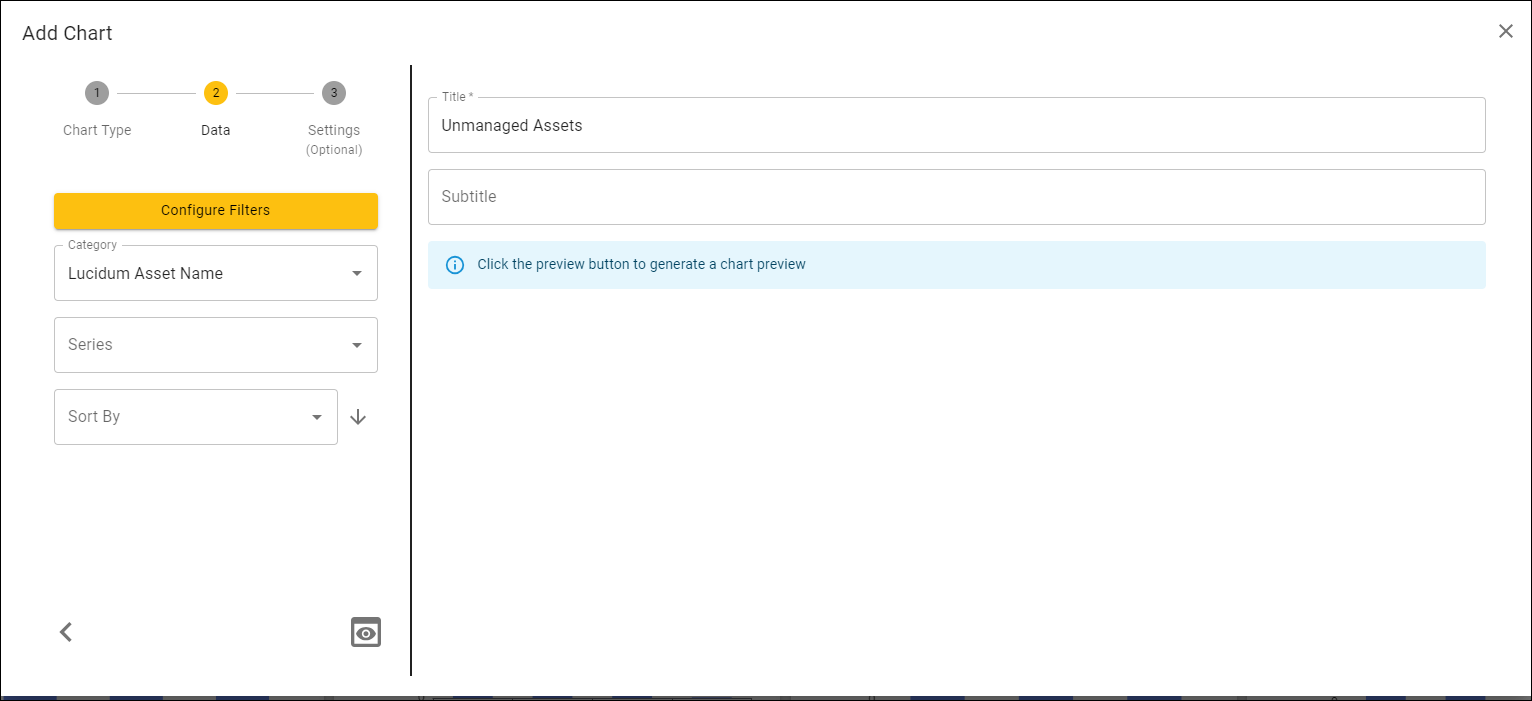
In the Add Chart or Edit Chart page, click the Configure Filters button. The Configure Filters for Chart page appears.
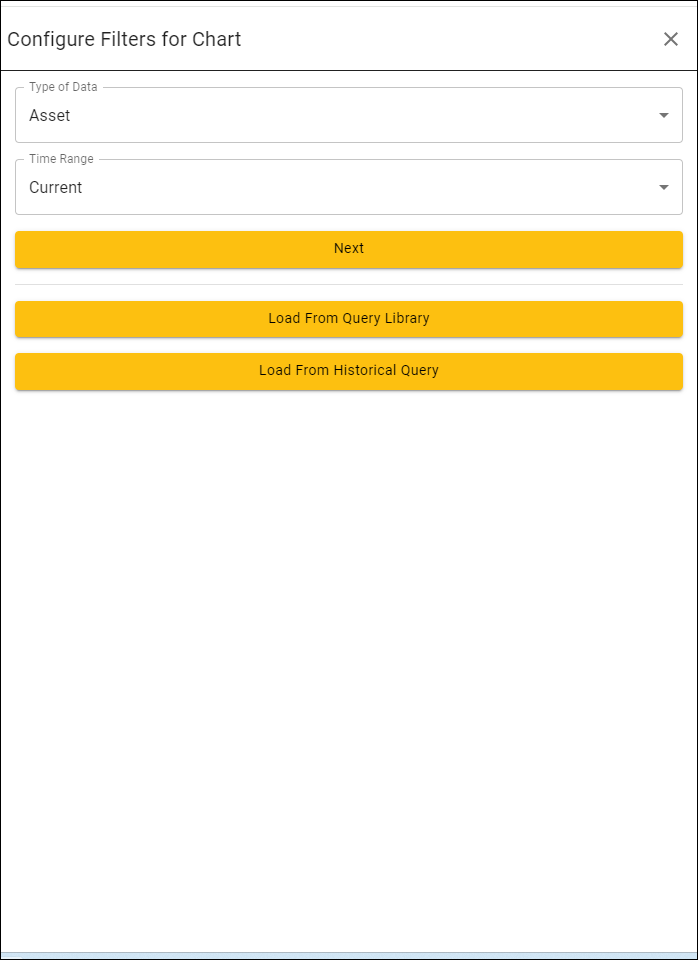
Follow the steps in the section Building the Query.
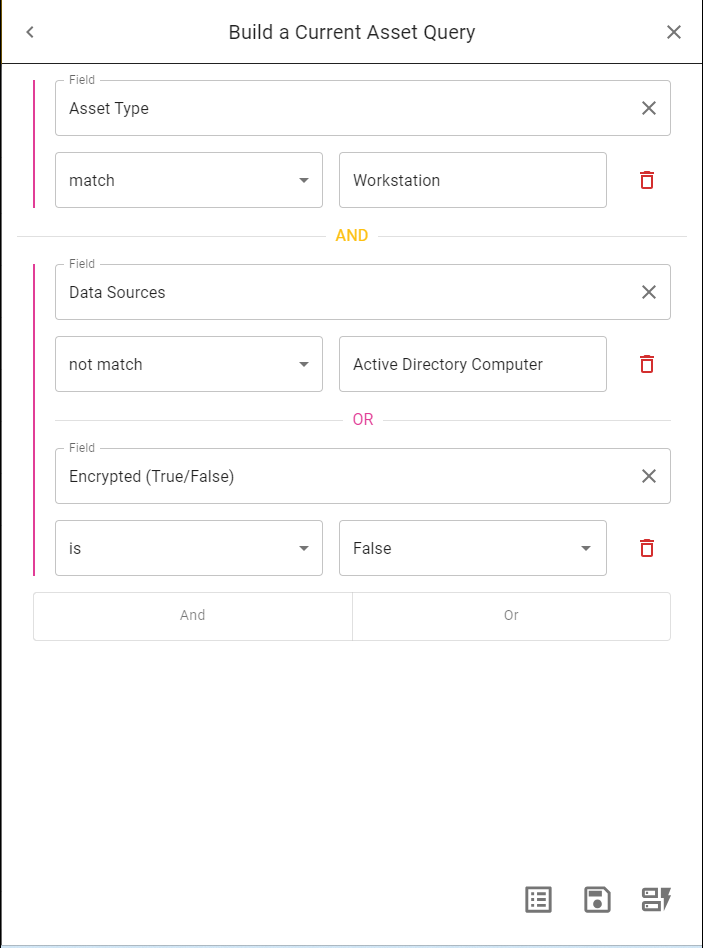
Building the Query
In the both the Build a Query page and the Configure Filters page, you follow the same steps to build a query.
Provide values in the following fields:
Field. In this field, you select a field for the query. A field is a characteristic of a Lucidum object, usually a column in a database table. For details about fields, see the section on Fields.
Operators. In this field, you select an Operator. The list of operators is dependent on the value you selected in Field. For details on operators for each data type, see the section on Operators.
Values. In this field, you select a value. This list of available values is dependent on the value you selected in Field and the value you selected in Operators.
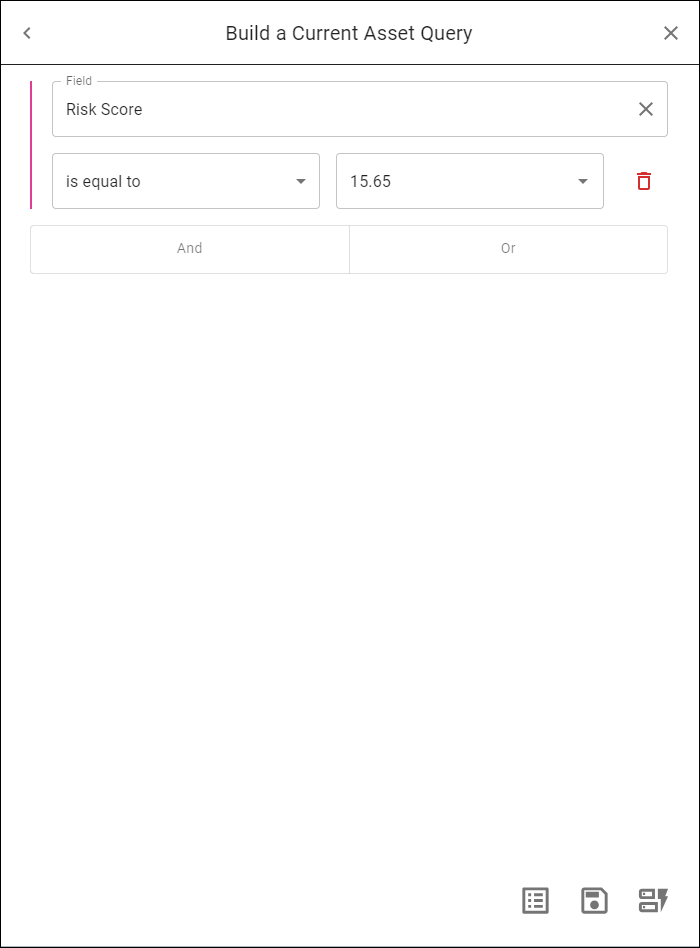
For the example query in the screen capture above, we specified:
Type of Data. Asset. We are interested in assets.
Time Range. Current. We will collect data from the database for the current .
Field. Risk Score. We will examine the field “Risk Score”.
Operator. is greater than or equal to. Because the Operator field includes operators for numeric values, we know “Risk Score” is a numeric value. We are looking for values of “Risk Score” that are greater than or equal to the value in Value.
Value. 15.65. Lucidum populates the list of values with all the values for “Risk Score” in the assets table for the current . We chose 15.65. So we are looking for values of “Risk Score” that are greater than or equal to 15.65.
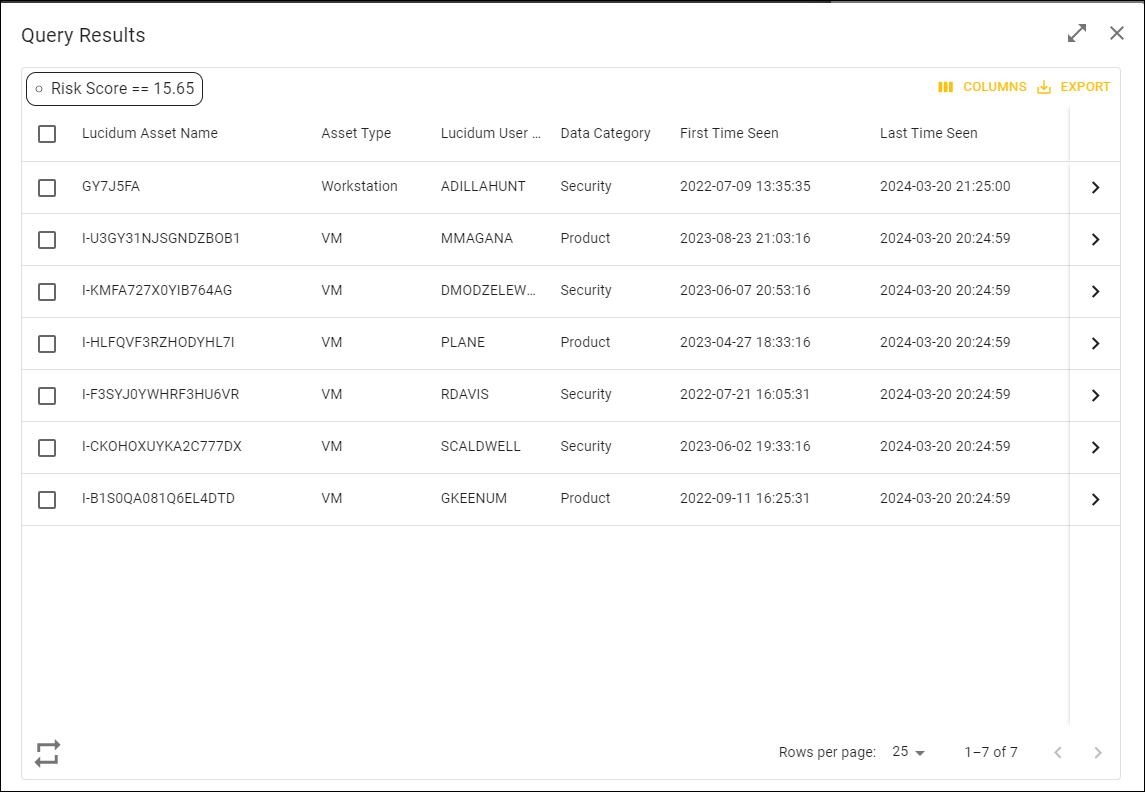
To see the results of the query, click the Show Result button. The Query Result page appears.
Fields
The Types of Data field specifies an object to examine. Choices are:
Asset
Asset-IP Mapping
User
User-IP Mapping
Vulnerability
When building a query, Fields are characteristics of the Lucidum objects. For example, a characteristic of a user is the user’s email address. A characteristic of an asset is the asset’s IP address. Usually, a field maps to a column name in a Lucidum database.
Lucidum ingests information about assets, users, and data from your environment. Lucidum correlates that information to provide you with details about assets, users, asset-IP mapping, user-IP mapping, and vulnerabilities.
For details on the standard list of fields in Lucidum and special characters you can use in queries, see the appendix on Fields and Regular Expressions.
Note that the list of fields is dependent upon the data you have collected with Lucidum connectors.
The list of fields that appear in your Lucidum system are the fields you can use to build queries.
You might see fields in the appendix that don’t appear in your Lucidum system. This means that Lucidum has not fetched that data from your environment, either because you have not yet configured the connector or because your environment doesn’t include that type of asset.
You might see fields called “Extra Fields” in your Lucidum system that don’t appear in the list of fields in the appendix. This means that Lucidum has fetched data from your environment that is either specific to your environment or not available in all environments.
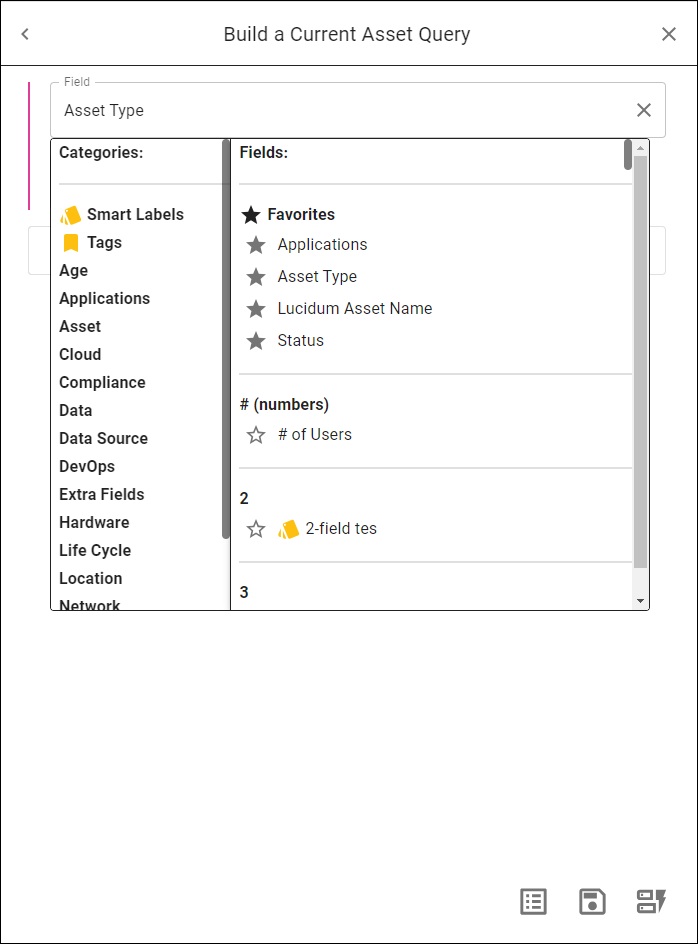
Creating Favorite Fields
Lucidum allows you to add frequently used fields to a list of Favorites.
If you frequently use a field, you can click the star icon next to the field name. The field then appears in the Favorite category at the top of the list of fields.
Operators
Operators define the relationship between the fields and the values.
Operators are dependent upon the data type.
For example, numeric data includes operators like “is equal to” or “is greater than”. Date and time data includes operators like “within past”. Text data includes operators like “match” or “is equal to”.
For details on each operator, see the appendix on Operators.
Values
The list of values is dependent on the Lucidum object, the Field, and the Operator. Lucidum populates the list of Values after you select a Lucidum object, Field, and Operator.
You can also use regular expressions in the Values field. For details, see the appendix on Fields and Regular Expressions.
For example, if you selected the following:
For example, if you selected the following:
Build Query from (Lucidum object). Asset
Field. Risk Score
Operator. is greater than or equal to
Value. 15.65
The Build Query from field indicates that we are interested in Assets.
Field indicates that we want to retrieve assets with a specific Risk Score.
Because Operators includes operators for numeric values, we know Risk Score is a numeric value.
Lucidum populates the Values with all the numeric values for all Risk Scores in the Assets database table. In our example above, we chose 15.65.
Writing Queries that Use AND and OR
Lucidum allows you to create multi-part queries. To do this, you can use AND and OR keywords.
The link for AND creates an AND condition.
The link for OR creates an OR condition.
AND Condition
An AND condition specifies that Lucidum should retrieve all records that match all conditions. You can specify as many conditions as you choose.
For example:
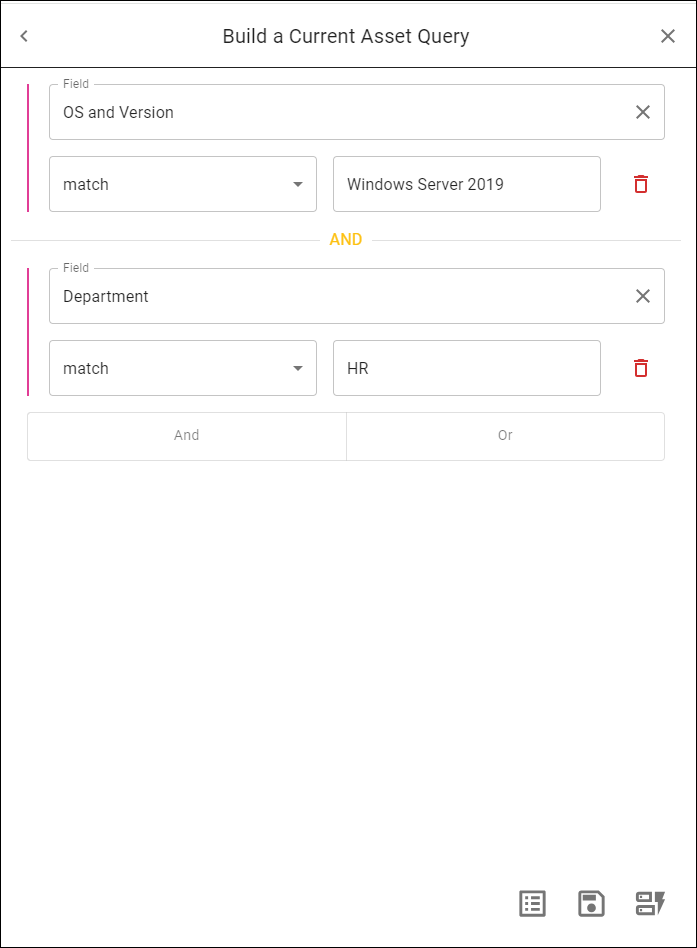
This query specifies that we are interested in all assets:
where the OS is Windows Server 2019
AND
the department is HR
Any asset that matches both criteria will be included in the Query Results page.
For example, using the query above, the Query Results page looks like this:
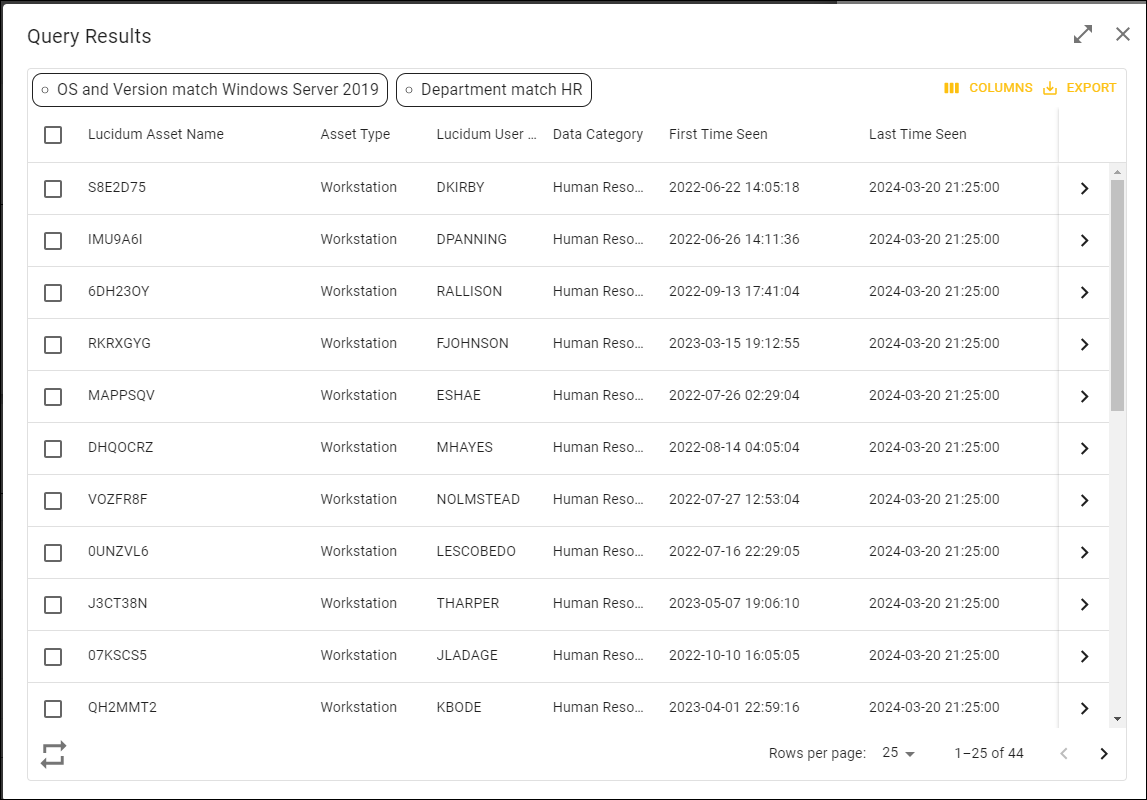
On this Lucidum system, 747 assets are running Windows Server 2019.
However, only 4 assets have both are running Windows Server 2019 and are in the HR department.
Therefore, the Query Results displays 44 assets.
OR Condition
An OR condition specifies that Lucidum should retrieve all records that match at least one of multiple conditions. You can specify as many conditions as you choose.
For example:
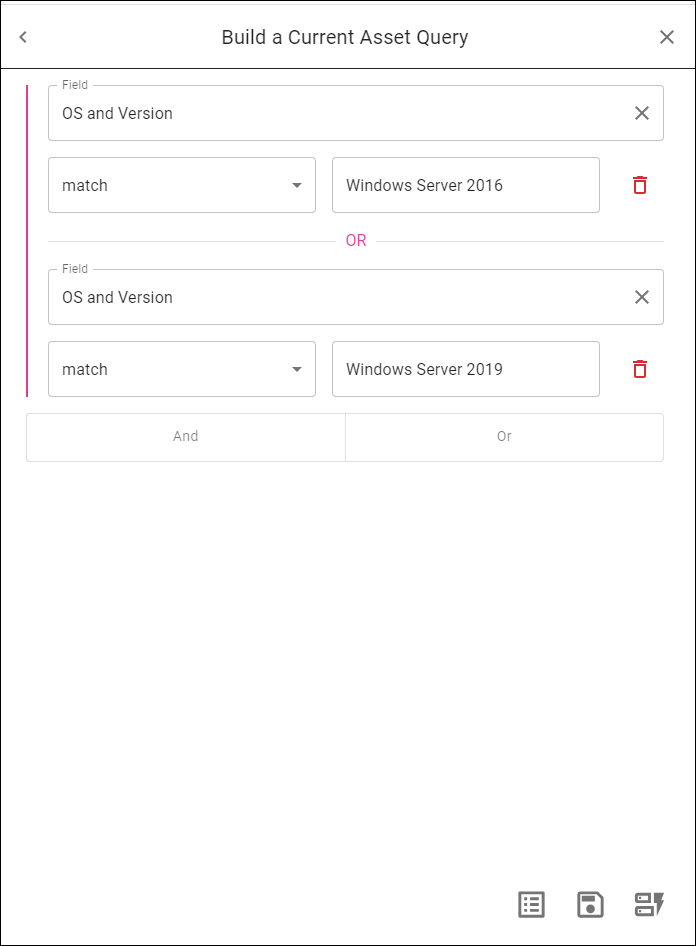
This query specifies that we are interested in all assets that:
have an Operation System of Windows Server 2016
OR
have an Operation System of Windows Server 2019
Any asset that matches either of these criteria will be included in the Query Results page.
For example, using the query above, the Query Results page looks like this:
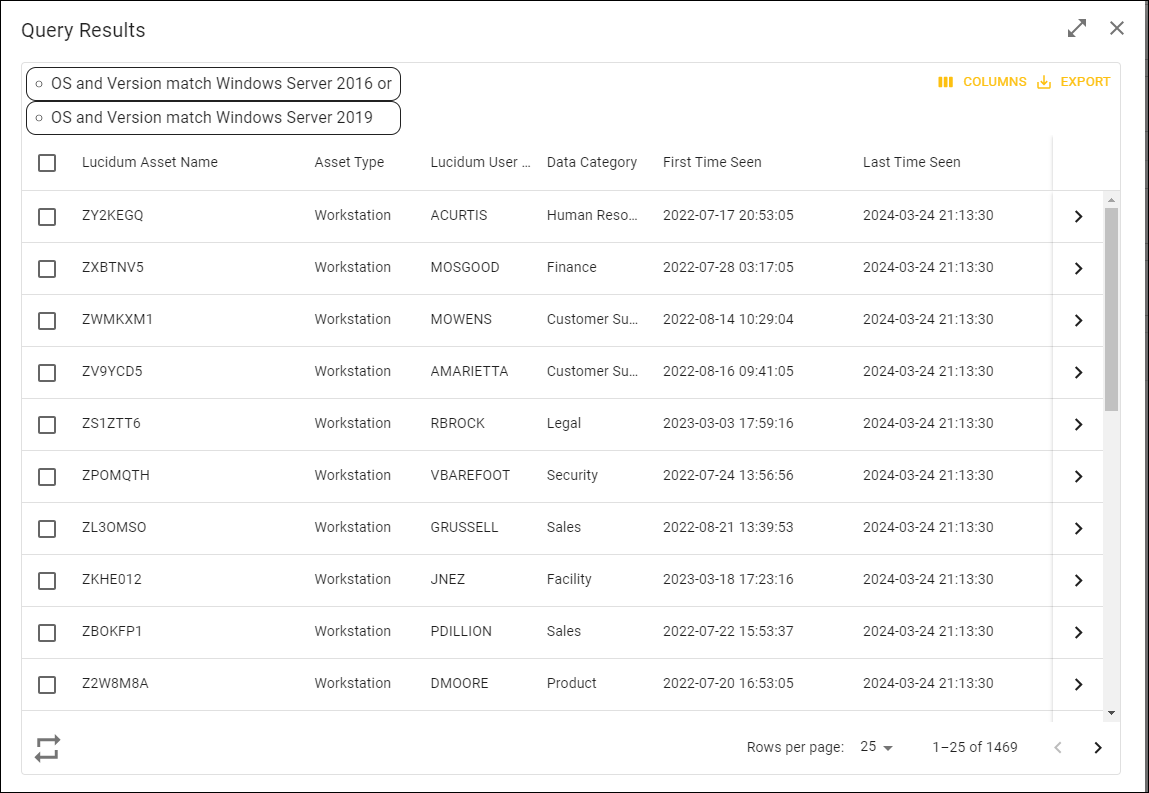
722 assets are running Windows Server 2016
747 assets are running Windows Server 2019
The Query Results page displays 1469 assets
Viewing Query Results
The Show Results (checklist) icon opens the Query Result page. The Query Result page displays a table populated with the results of the query for the chart.
Using an example query:
This query specifies that we are interested in all assets that:
have an OS and Version that matches Windows Server 2016
or
have an OS and Version that matches Windows Server 2016
Any asset that matches the criteria will be included in the Query Results page.
For example, using the query above, the Query Results page looks like this:
The Query Results page displays a list of assets that are running either Windows 2019 or Windows 2016.
You can sort the page by the column headings.
To see additional details about an asset, scroll to the right.
NOTE: If a column displays a list/array value, the column will display:
Empty. The field does not include a value.
One value. The field includes a single value..
Count: <number of values in the array>. The field includes multiple values. To view the list of values, click the > icon to view details about the record.
In the Query Results page, you can perform the following:
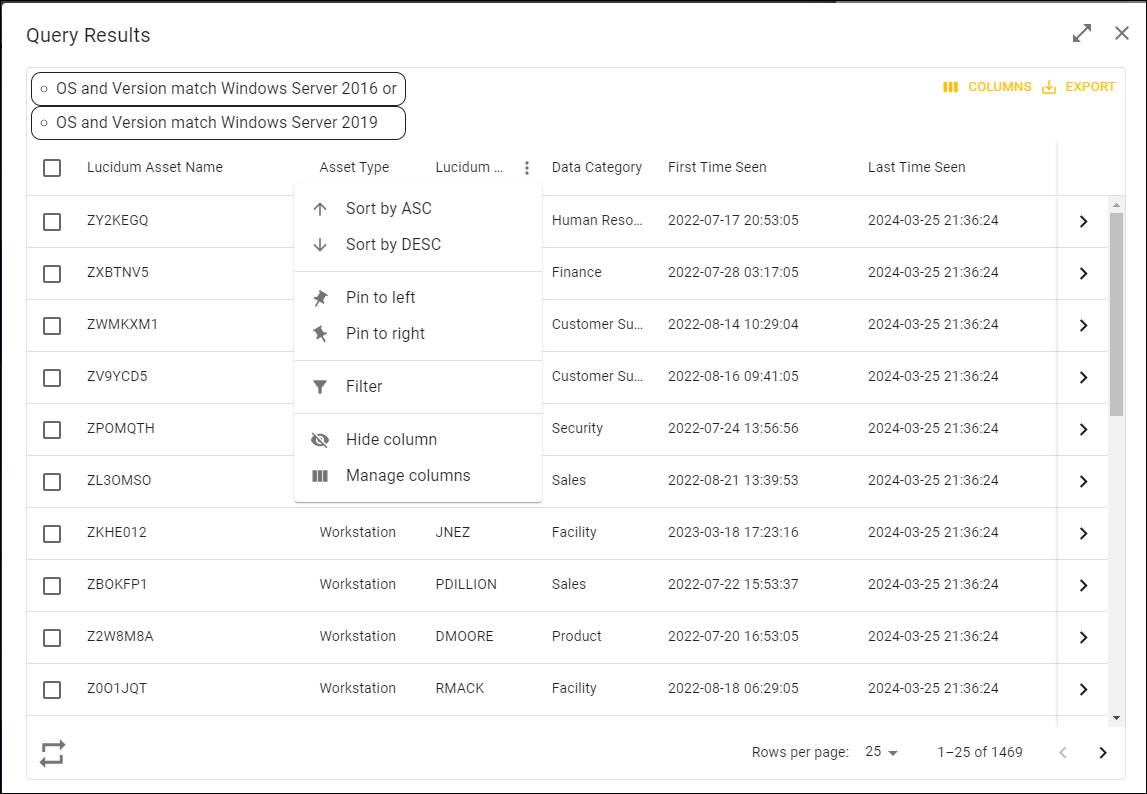
For each column name, you can:
Sort by ASC. Sort the results by this column, in ascending order.
Sort by DESC. Sort the results by this column, in descending order.
Pin to left. The column is pinned to the left border. When you scroll left to right to view all the columns, this column stays on the left border.
Pin to right. The column is pinned to the right border. When you scroll left to right to view all the columns, this column stays on the right border.
Filter. Allows you to filter the table by one or more columns in the results table.
Hide Column. Removes the column from the page.
Manage columns. You can include or not include one or more columns in the results table.
If you select the checkbox for an entry in the Query Results page, you can also:
Create a recurring action with this query. Use the results of the query to create an action. Upon selecting this option, Lucidum displays the Create a new action page, where you can define the action. For details on actions, see Actions.
Create a one-time action with selected data. You can select one or more records and create an action that uses selected records and runs only once. For details on actions, see Actions.
Add a Tag. Apply a tag. Tags are defined in the Tag Management page (Settings > Tag Management), can be manually applied to assets and users, and can be selected as a fields in a query. For details, see Streamlining Queries with Smart Labels and Tags.
Details page
When we go to the row for asset ZC4YAA2 and click on click on the > icon, we see the following:
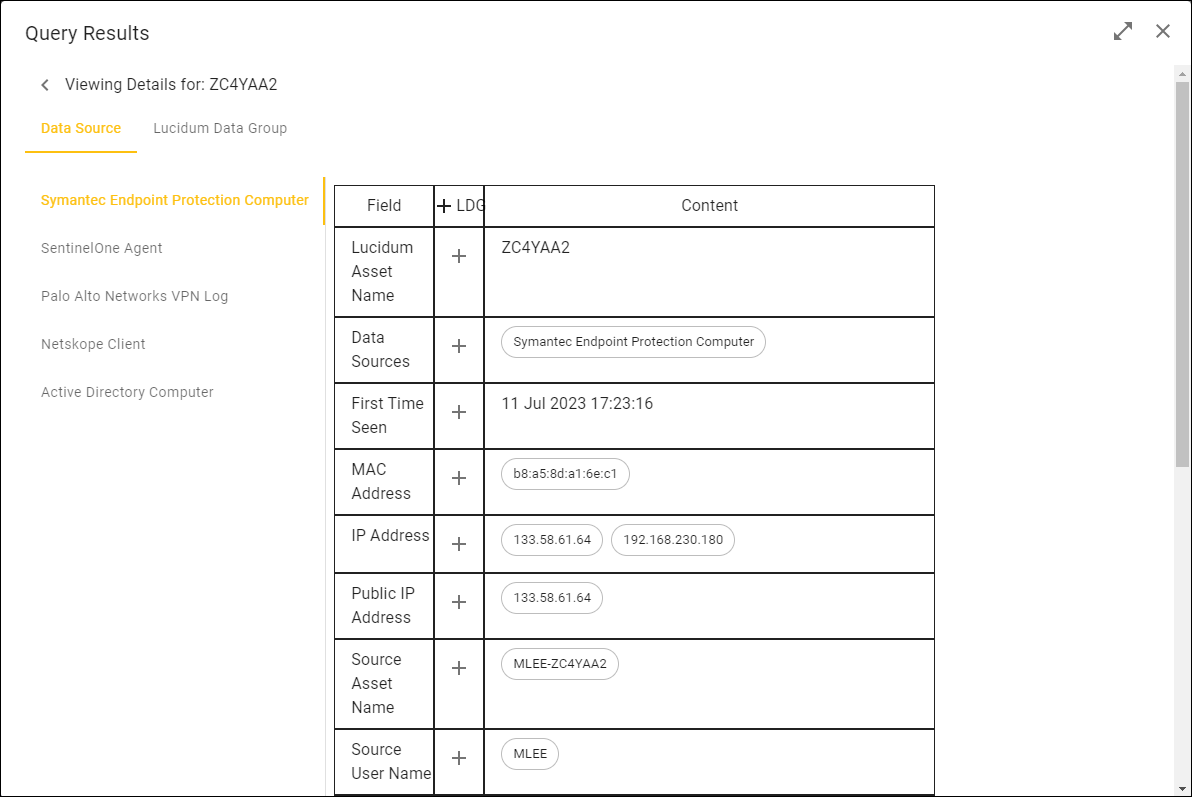
Notice there are two tabs: Data Source and Lucidum Data Group.
The Data Source tab display allows you to see all the data sources from which Lucidum ingested data about the asset. You can select a Data Source to see which raw data was provided by that data source.
For our example chart, we selected Symantec Endpoint Protection Computer. You can view the data about this asset that Lucidum ingested from Symantec Endpoint Protection.
You can add a field from a Data Source to the Lucidum Data Group. You can then query that field in the Query page. To add a field to the Lucidum Data Group, click the plus-sign ( + ) in the LDG column.
The Lucidum Data Group tab displays the data that you can query for this asset. Lucidum ingests data from multiple data sources and uses machine learning to deduplicate and triangulate data for each asset and normalize that data.
For more details on the Viewing Details page, see Viewing Details about Individual Assets, Users, or Vulnerabilities.
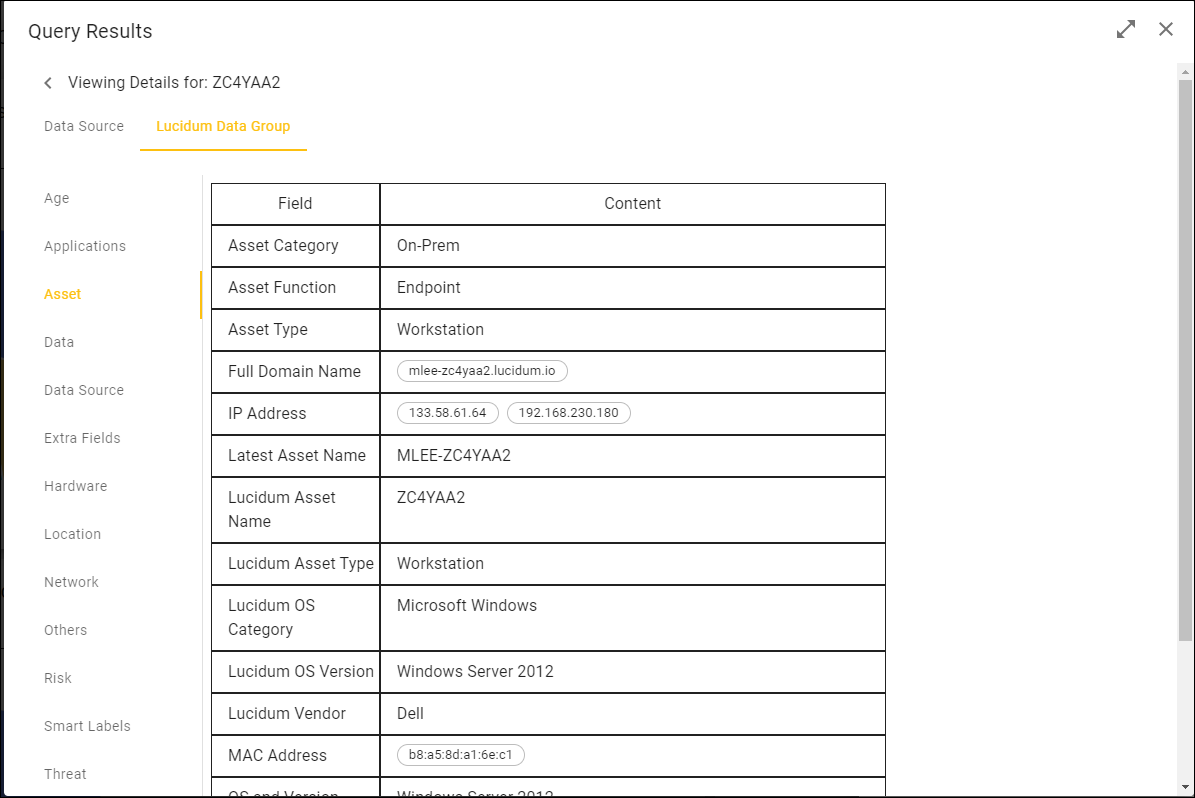
For our example chart, from the Details page we selected the Lucidum Data Group tab and then the Asset field. We can then see what kind of information Lucidum stores for Assets.
Exporting a Query to a .CSV File
From the Query button, you can export queries to a .CSV file for use in reports or analysis outside of Lucidum.
To do this:
Create a query or choose a Saved Query or choose a query from Query History.
To see the results of the query, click the Show Result button. The Query Result page appears.
In the Query Results page, click the Export icon in the upper right corner. Choose Export.
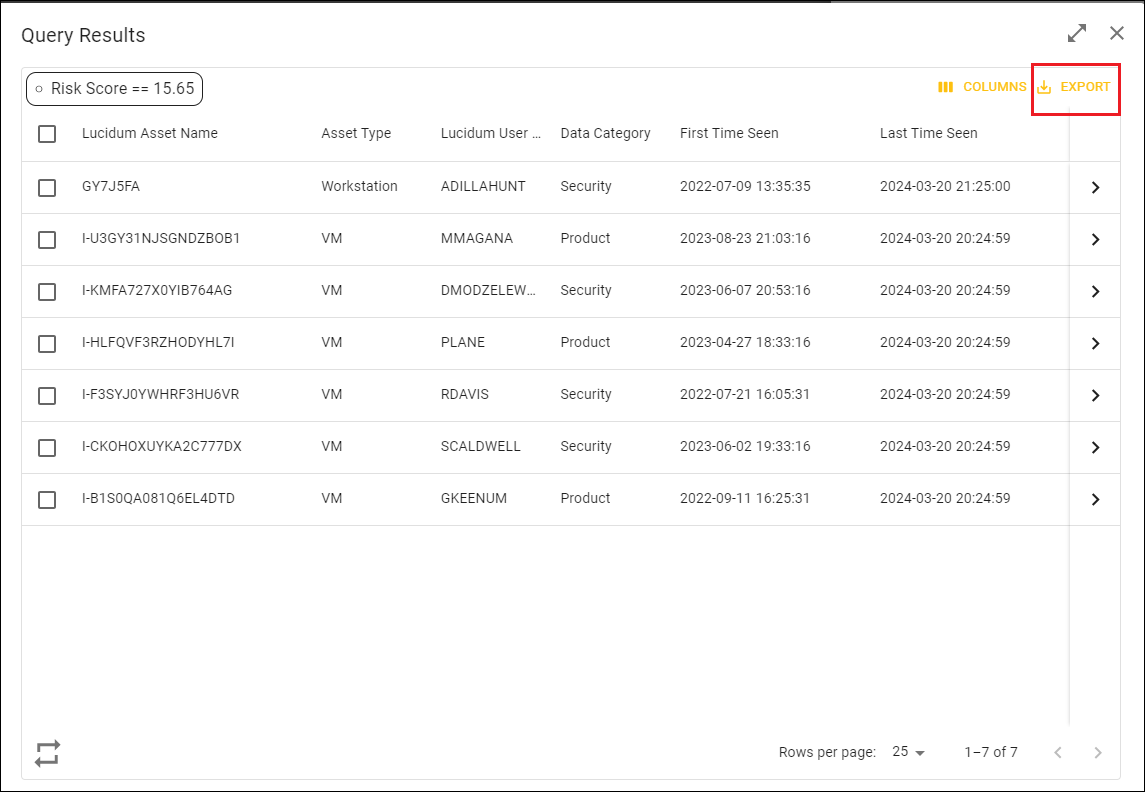
The query and its results are saved to a .CSV file on your local computer.
Using Saved Queries and Query History
The Query page includes fields for re-using queries:
Saved Query. Leads to a list of saved queries. Saved queries are associated with your login. You cannot view the saved queries from other Lucidum users.
Query History. Leads to a list of cached queries. Query history is not associated with your login but instead includes all queries from all Lucidum users on the current Lucidum system. Query history is deleted when the Lucidum system is rebooted or restarted.
For details on creating, using, and managing saved queries and historical queries, see Saved Queries and Historical Queries.
Using Smart Labels and Tags
Lucidum includes two types of user-defined fields to make repetitive tasks easier and to help organize assets and users:
Smart Labels. You can create a query and save the query as a Smart Label. These new fields are called Smart Labels. In the Query page, the Smart Label will appear under the category Smart Labels and can be used in queries. You can manage Smart Labels in the Smart Label Management page (Settings > Smart Label Management).
Tags. Custom fields are tags that you can create and assign to assets and users to aid management. You can create tags in the Tag Management page (Settings > Tag Management). You can manually assign tags to users and assets in the Query Results page. In the Query page, the tags appear under the category Tags and can be used in other queries.
For details on creating, using, and managing Smart Labels and tags, see Streamlining Queries with Smart Labels and Tags .
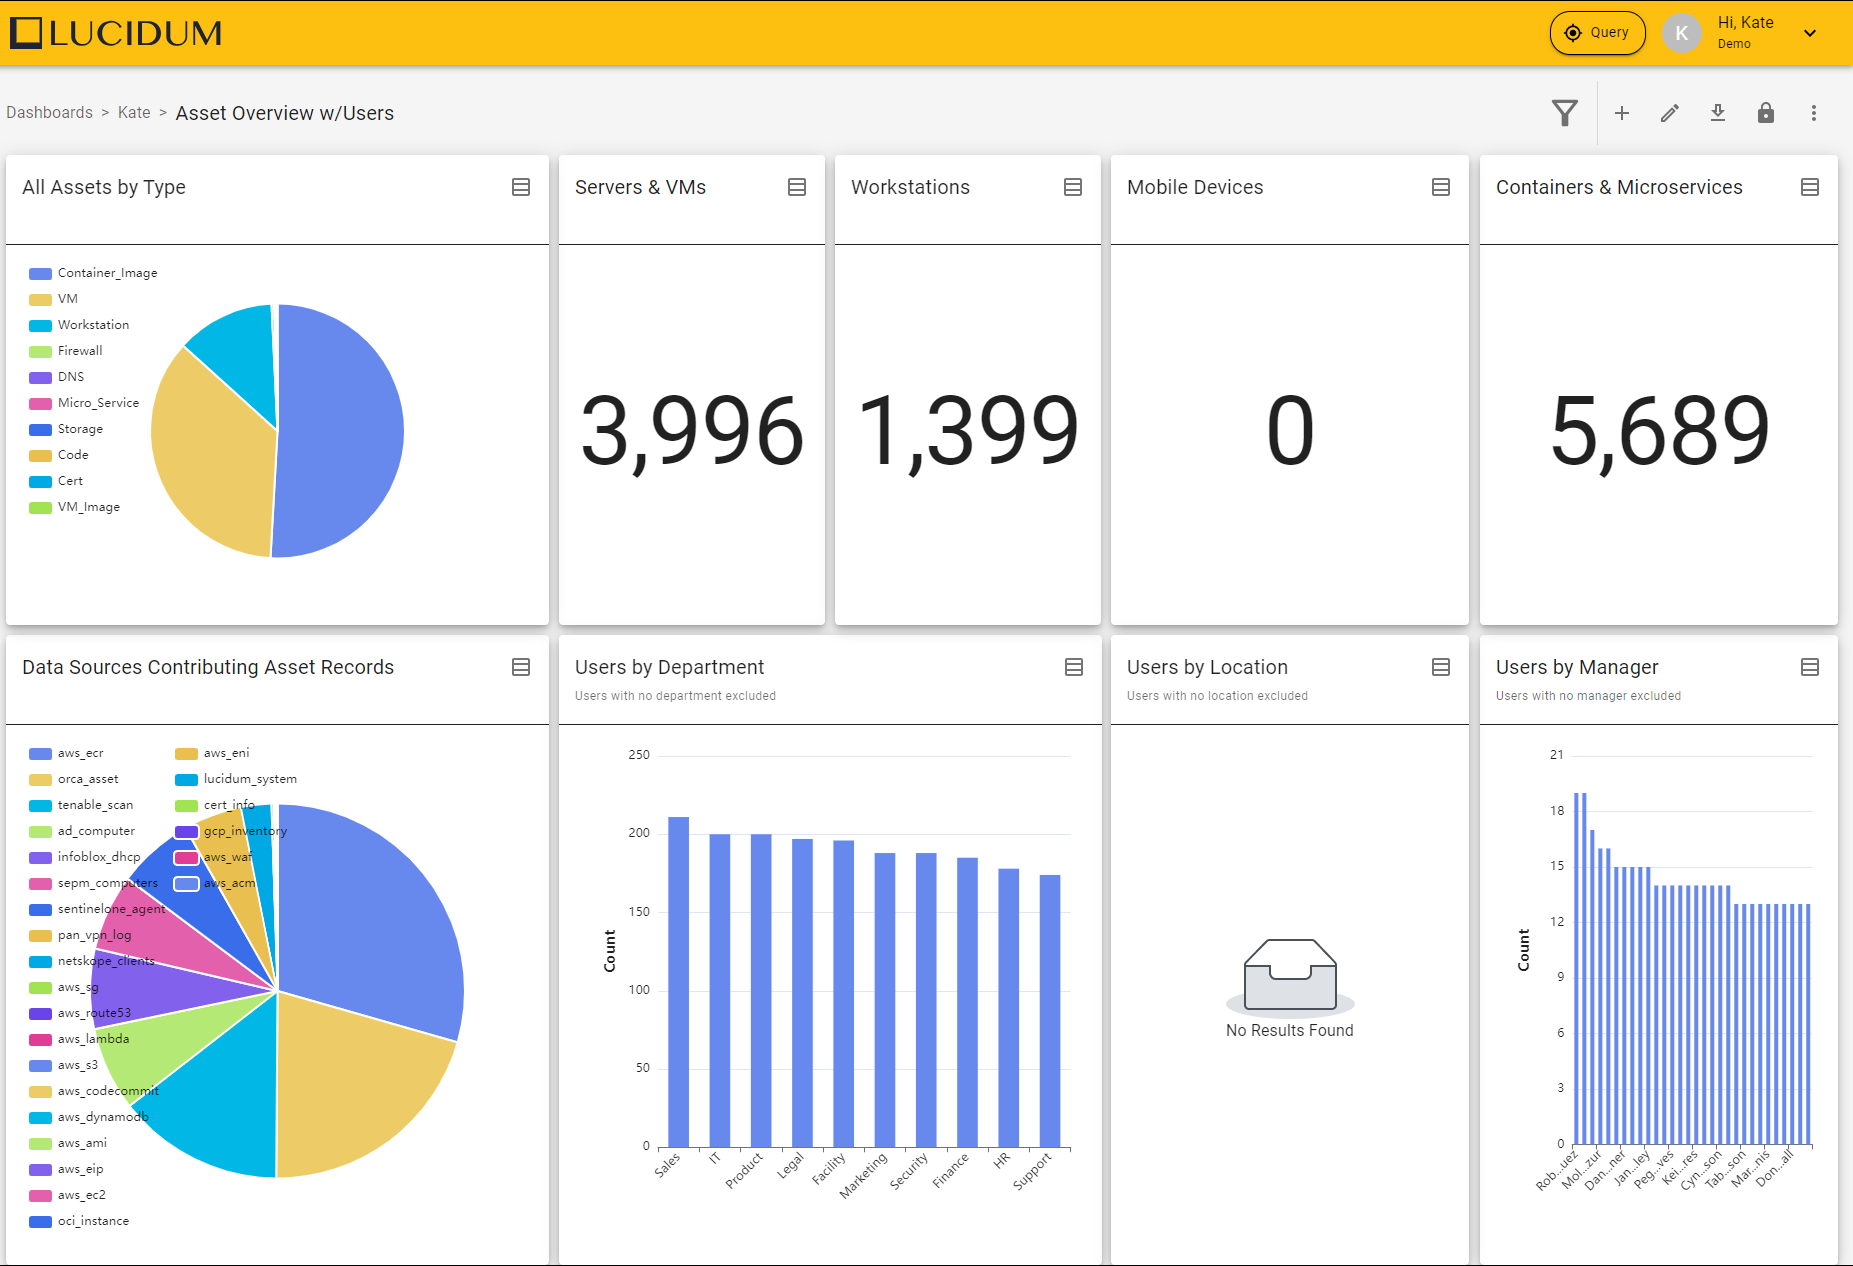
Creating a Global Filter
A global filter is a parent filter that is applied to all queries and all charts in a specific Dashboard.
To create a global filter:
Open the dashboard you want to add a filter to.
Click on the Refine Scope (funnel) button.
In the Build a Query page, create a query as you normally would.
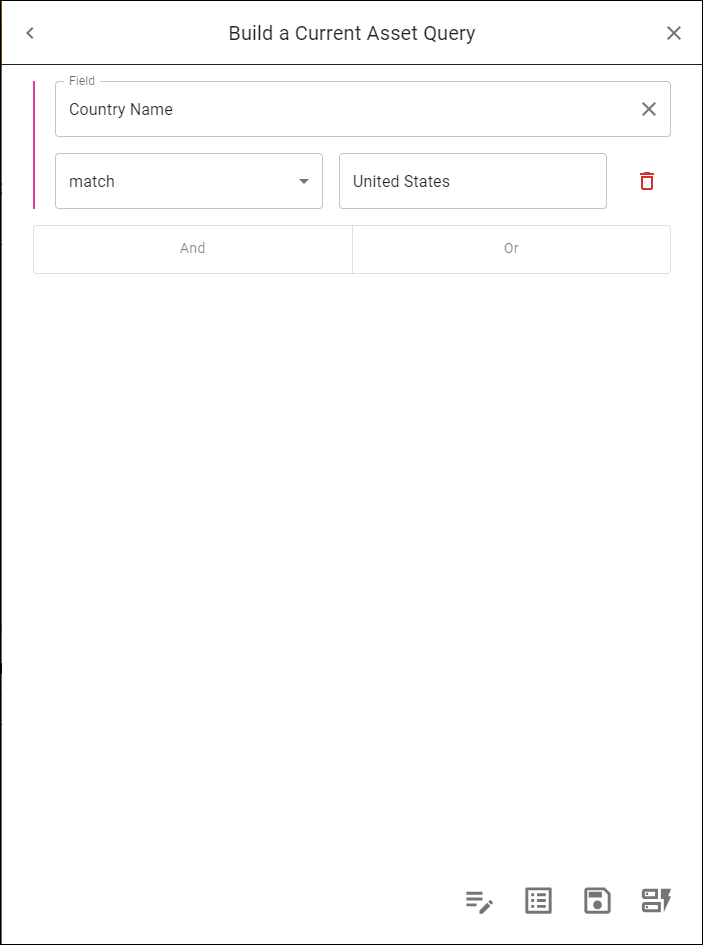
Click Apply to apply the query to all charts in the current dashboard.
The new filter appears to the left of the Refine Scope button.
The new filter is applied to all the charts and queries in the dashboard.
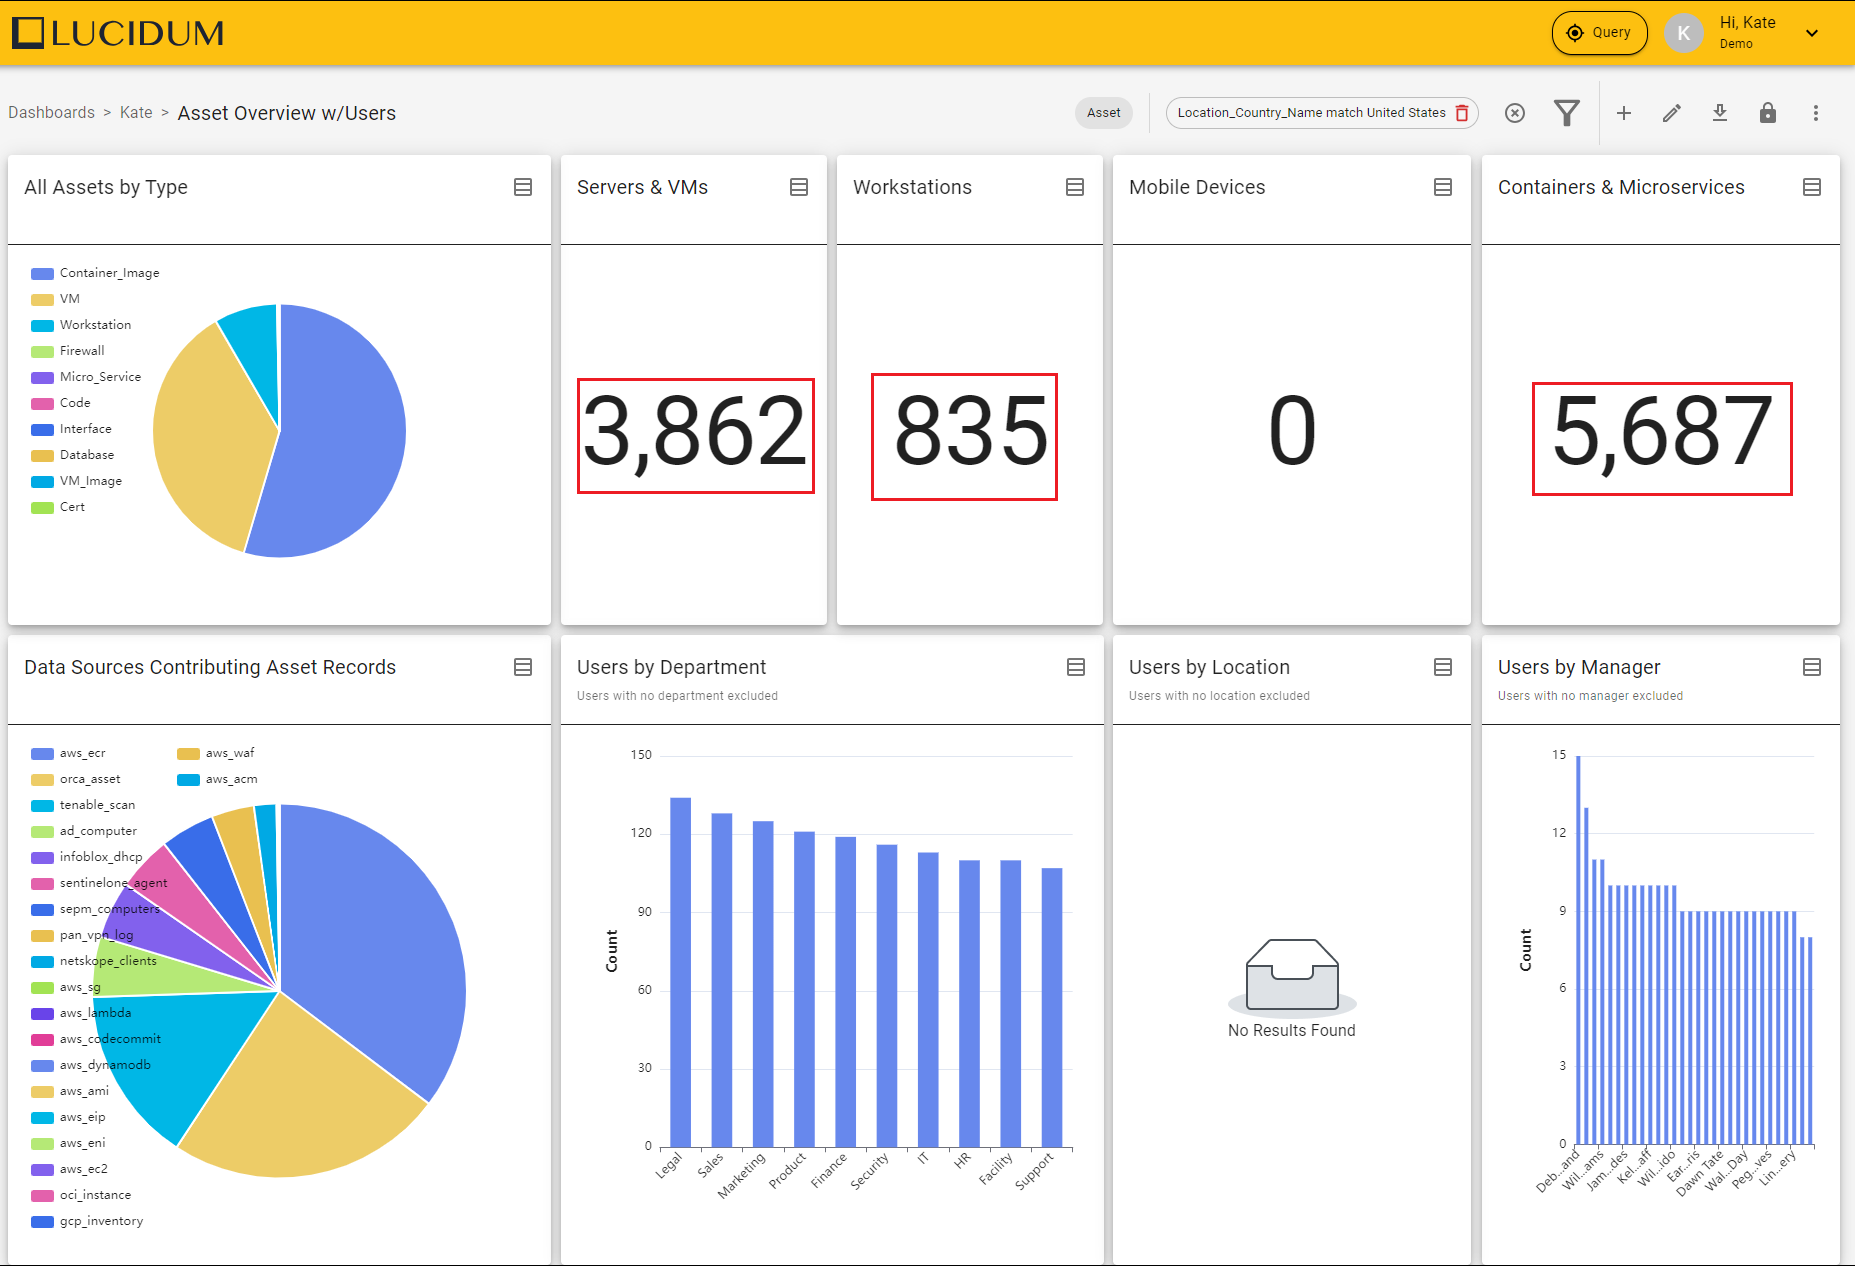
In our example, we created a query that filtered assets by the Country Code match United States. Notice how the value in the “Workstations” chart, the “Servers & VMn” chart, and the Containers & Microservices chart has changed after we applied the global filter. This is because all queries and charts include only assets with the Country Name “United States”.