Viewing Details about Individual Assets, Users, or Vulnerabilities
Connectors
Lucidum connectors provide the data to your lucidum system.
Connectors allow Lucidum to ingest data from your environment and discover, identify, and classify assets, data, and users. Lucidum includes pre-built connectors for the most commonly used solutions for security, vulnerability scanning, cloud, data warehouse, identity management, logs, network, endpoint management, IP management, file sharing, and devops.
To configure a connector, you provide credentials that allow Lucidum secure, read-only access to a deployed solution.
The more connectors you configure, the better your data set.
Data Source and Lucidum Data Group
You can view details about the data for a single asset, user, or vulnerability.
For assets and users, Lucidum deduplicates, triangulates, and aggregates the raw data from connectors to provide you with enriched data about assets, users, and vulnerabilities.
There are two types of data in Lucidum, both of which you can view in Lucidum and use in dashboards:
Data Source. Data sources map to connectors. For each asset, user, and vulnerability, you can view all the data sources from which Lucidum ingested data about the asset, user, or vulnerability. You can select a Data Source to exactly see which raw data was provided by that data source.
Lucidum Data Group. Enriched data about assets, user, and vulnerabilities. Lucidum ingests data from multiple data sources and uses machine learning to deduplicate and triangulate data for each asset and normalize that data. The Lucidum Data Group tab allows you to view this enriched data for each asset, user, and vulnerability. Data in the Lucidum Data Group appears as fields in the Query tool.
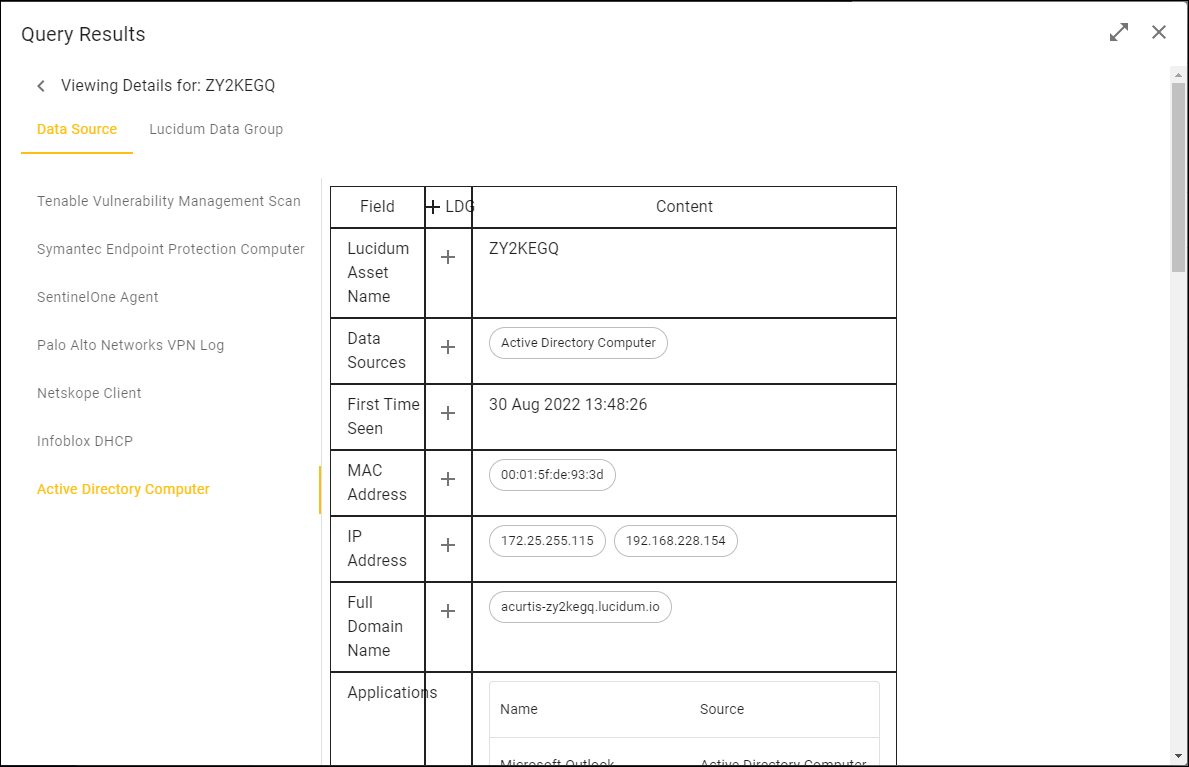
Viewing Details from the Data Source Tab
Data Sources contain the raw data that is ingested by Lucidum connectors from your environment. For example, Data Sources can include Tenable, SentinelOne, Infoblox, Active Directory, AWS, VMware. Within each Data Source is the raw data collected by Lucidum for an asset.
For example, an Active Directory data source for an asset would include the information you would expect to find in an Active Directory record for that asset.
To view the raw data that Lucidum ingested about an asset, user, or vulnerability:
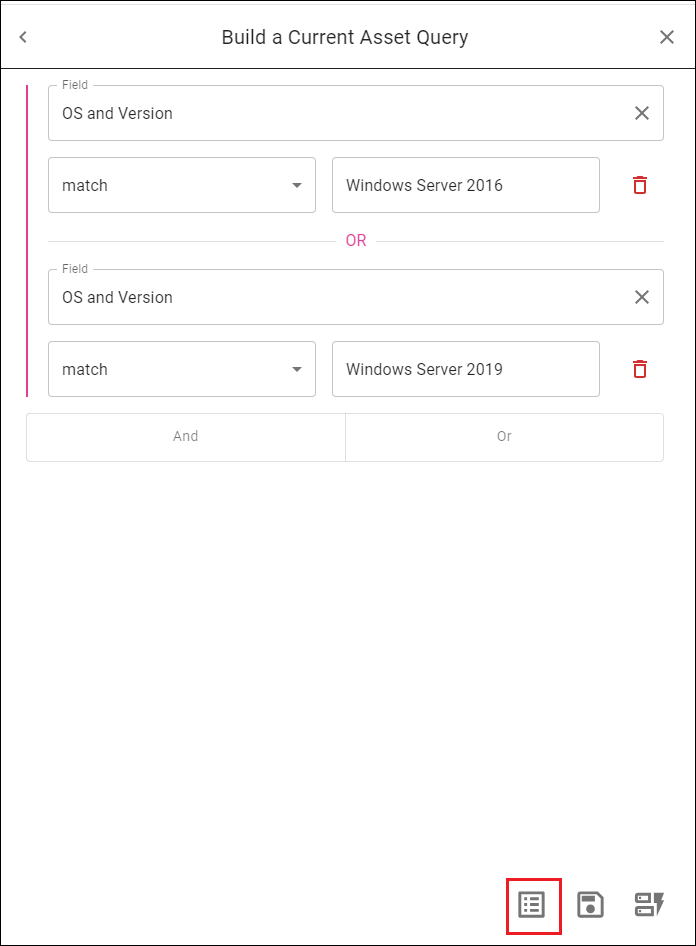
Follow the steps in in the section on Building the Query.
In the Build a Query page, click the Show Results (page) icon in the lower right.
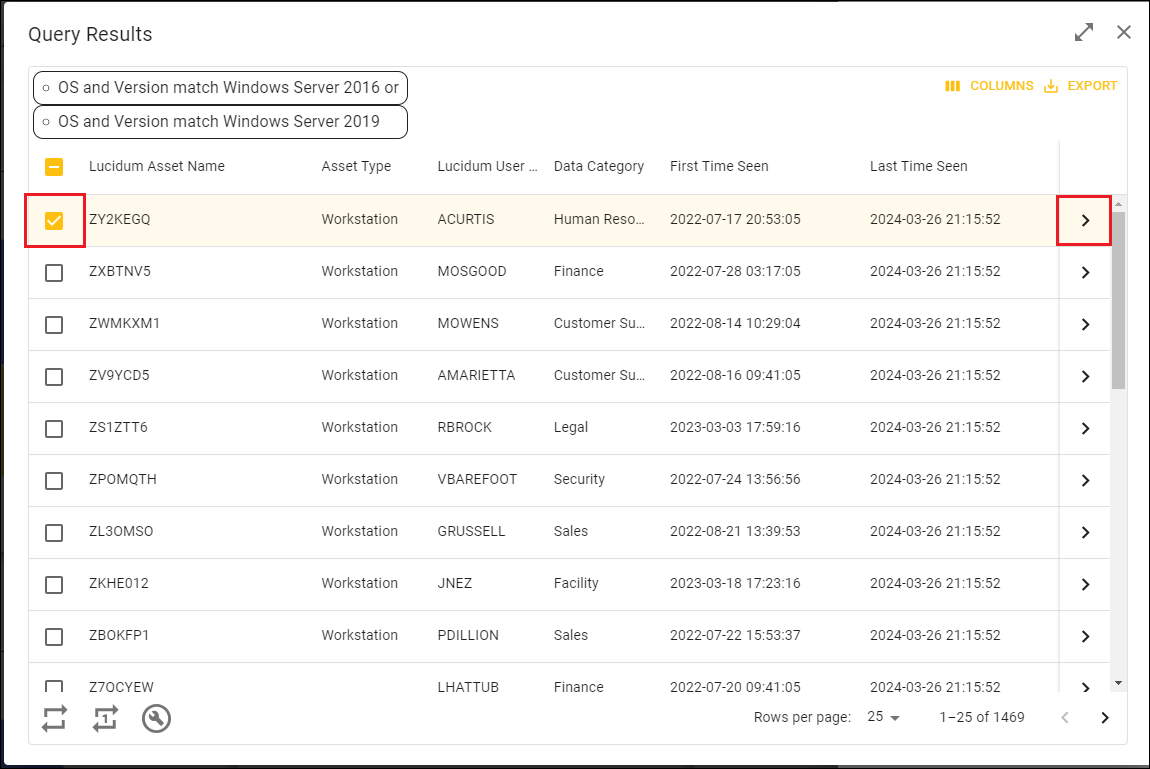
In the Query Results page, find the asset, user, or vulnerability you are interested in. Click the checkbox for that entry.
Click the > icon in the column farthest to the right.
In the Viewing Details page, click the Data Sources tab.
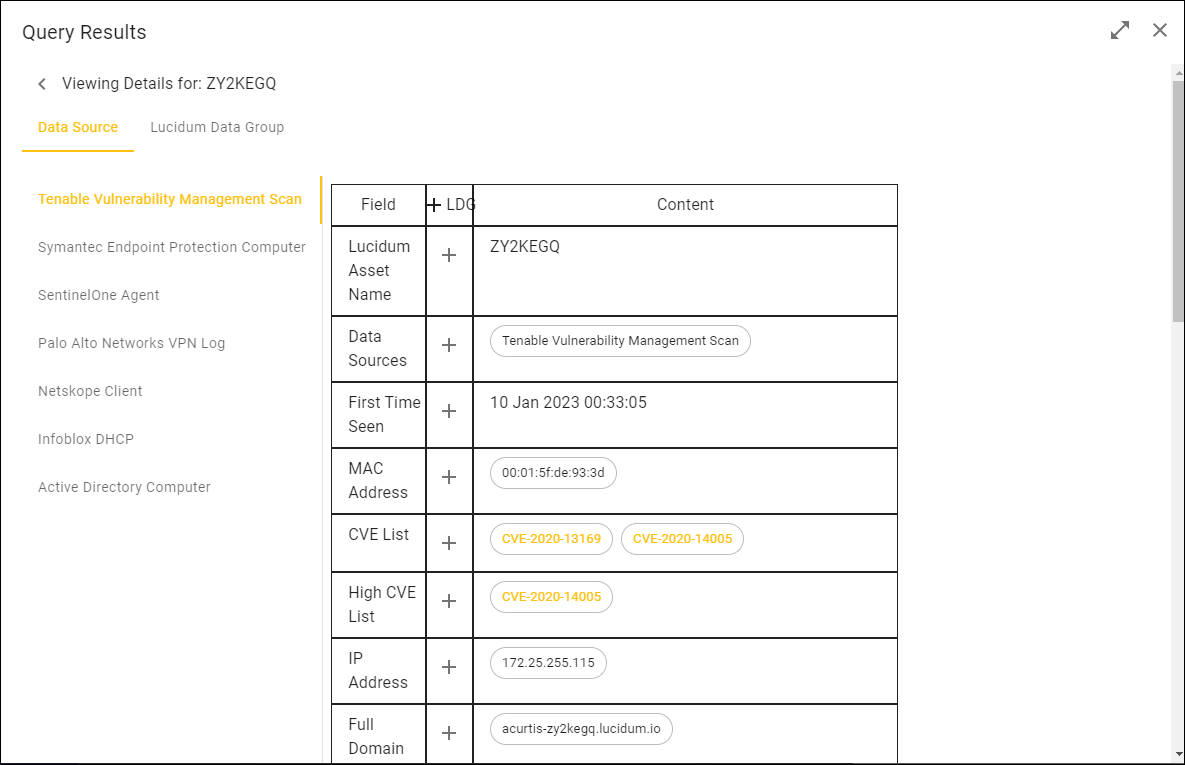
In the Viewing Details page, in the right pane, select a data source to see the data that Lucidum ingested from that data source about this asset, user, or vulnerability.
Viewing Enriched Data
After ingestion, Lucidum cleans up the raw data and fills the gaps between security solutions. After ingesting data from connectors, Lucidum enriches that data through machine learning.
Enriched data includes:
Lucidum-derived fields. These are values that Lucidum derives from one or more data sources and then “normalizes”.
Lucidum-generated fields. These are values that Lucidum generates via Lucidum Machine Learning engines..
To view the enriched data about an asset, user, or vulnerability:
Follow the steps in in the section on Building the Query.
In the Query page, click the Show Results (page) icon in the lower right.
In the Query Results page, find the asset, user, or vulnerability you are interested in. Click the checkbox for that entry.
Click the > icon in the column farthest to the right.
In the Viewing Details page, click the Lucidum Data Group tab.
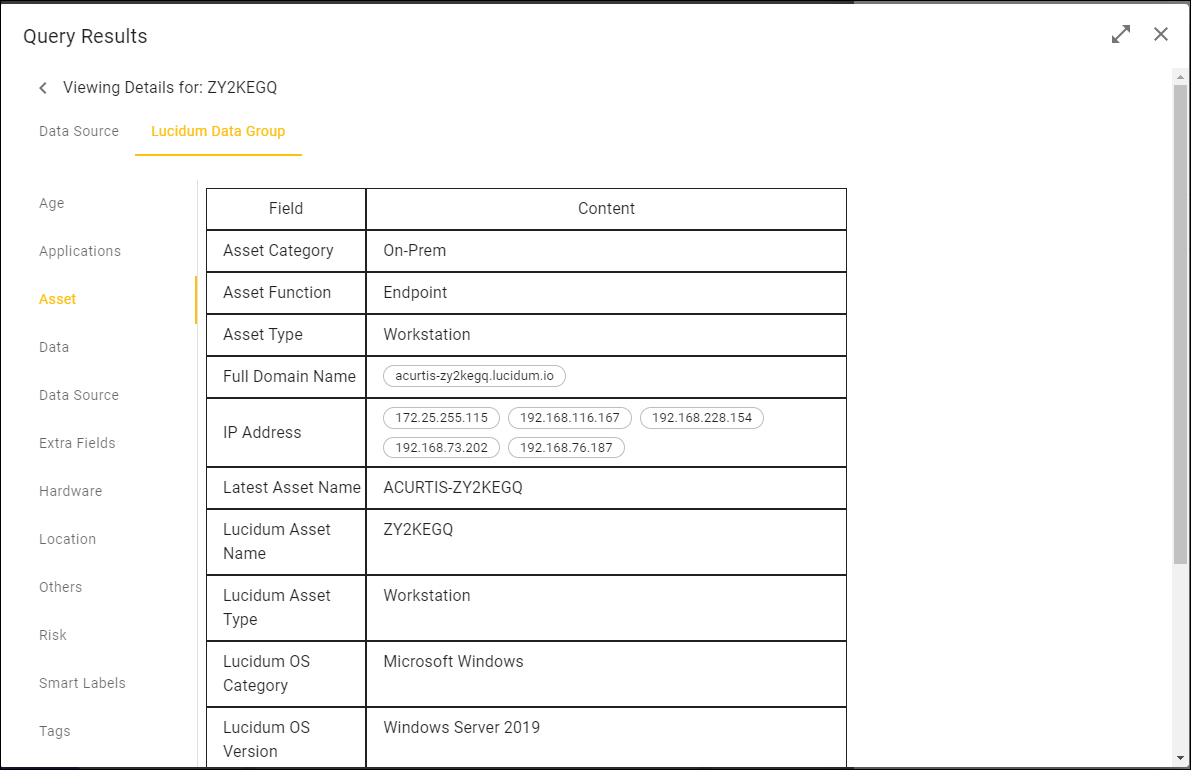
In the Viewing Details page, in the left pane, select the category of enriched data you want to view.
After each ingestion, Lucidum:
Deduplicates records. For example, suppose an asset uses DHCP. Suppose Lucidum ingests different information about that asset each day. However, each day, that asset will lease a new IP address. Instead of creating multiple asset records, Lucidum creates a single record for that asset. The single record includes all the IP addresses associated with the asset over time.
Triangulates records. Suppose a single user appears in multiple solutions with multiple versions of a user name. For example, suppose Lucidum ingests a different name from Azure AD, GitHub, and Intune. Suppose Lucidum ingests the names “John.Smith”, “SmithJ”, and “john.smith@lucidum.io”. Lucidum creates a single entry for that user with a single user name and enriches the user record with information from Azure AD, GitHut, and Intune.
Aggregates records. Suppose Lucidum ingests data about an asset from CarbonBlack, Tenable, Intune, VMware, and InfoBlox. Each data source provides some information. Some of these data sources provide unique information. For example, one solution might provide OS and version, another solution might provide vulnerabilities, another solution might provide hardware information, another solution m7ight provide application data, and another solution might provide cloud information. Lucidum creates a single asset record that aggregates all the data from the multiple solutions.
Derives Data. Suppose you are interested in broader categories of data to provide a high-level overview in dashboards and reports. In these cases, Lucidum can strip out extraneous detail without losing accuracy. For example, suppose you are interested in operating systems running in your environment. Lucidum can provide you with a list of devices running Linux, Windows, and MacOs, regardless of the flavors or versions. Or suppose you want a list of all Windows 10 devices, regardless of the build of Windows 10.
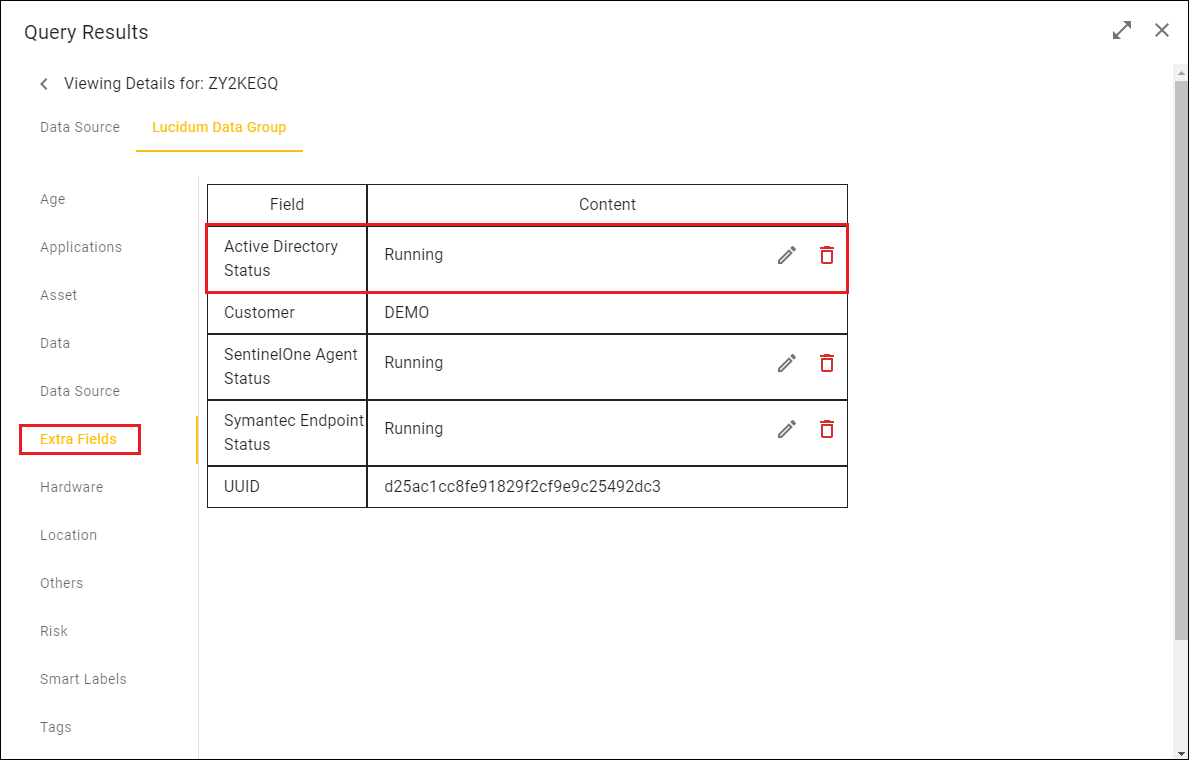
Note that the Lucidum Data Group tab includes categories for Smart Labels and Tags. Note that in the Tags category, the Lucidum Data Group also displays the tags ingested from the source asset or user.
Adding Fields to the Lucidum Data Group
There might be instances where you organization prefers to use a raw value from a data source instead of a value from the Lucidum Data Group. In this situation, you can add a value from a data source to the Lucidum Data Group.
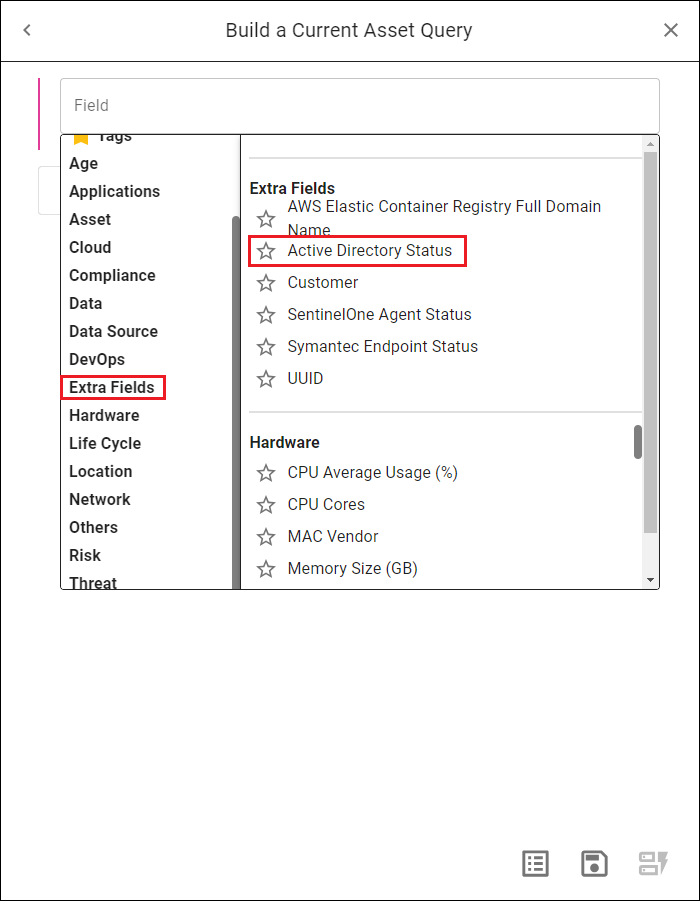
In the Viewing Details page, the field will appear in the Extra Fields category of the Lucidum Data Group.
You can also query the field from the Query page. The field resides in the Extra Fields category in the Query page.
To add a field to the Lucidum Data Group:
To view the raw data that Lucidum ingested about an asset, user, or vulnerability:
Follow the steps in in the section on Building the Query.
In the Query page, click the Show Results (page) icon in the lower right.
In the Query Results page, find the asset, user, or vulnerability you are interested in. Click the checkbox for that entry.
Click the > icon in the column farthest to the right.
In the Viewing Details page, click the Data Sources tab.
In the Viewing Details page, in the right pane, select a data source to see the data that Lucidum ingested from that data source about this asset, user, or vulnerability.
If values in the table include a plus-sign in the LDG column, you can add that field to the Lucidum Data Group.
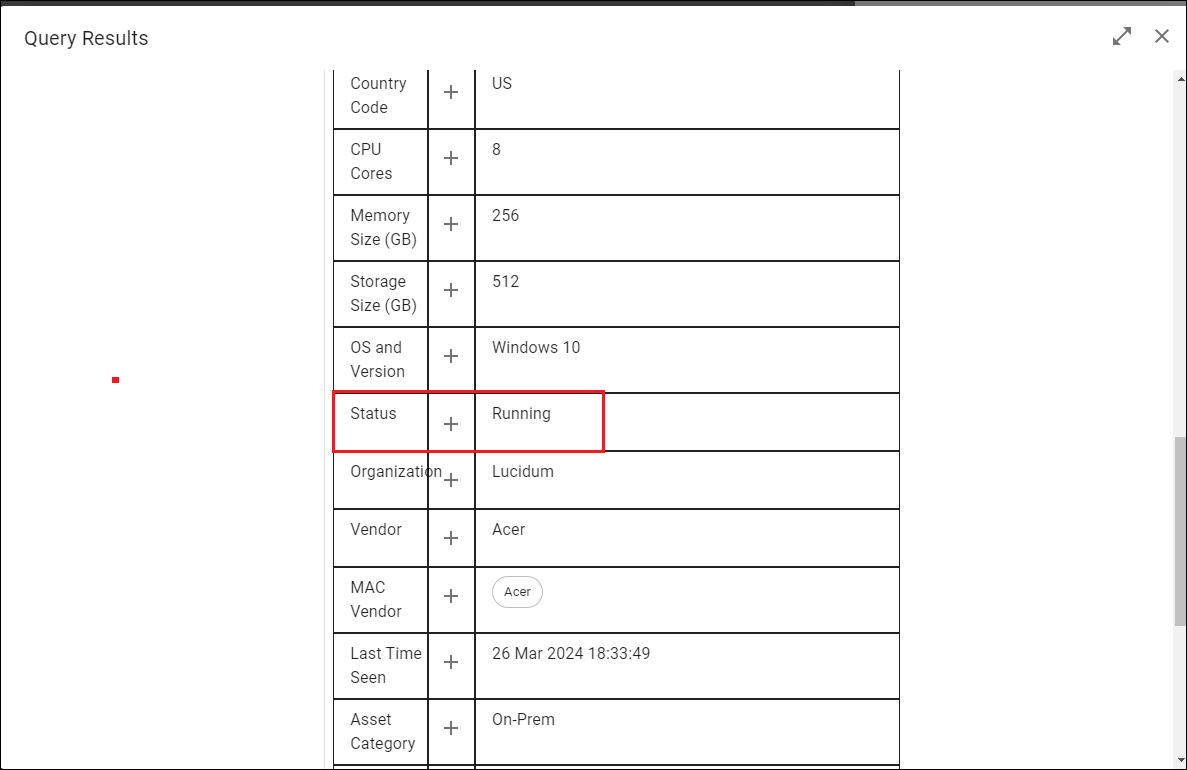
Click the plus-sign to add a field to the Lucidum Data Group. The Edit Field in Lucidum Data Group modal appears:
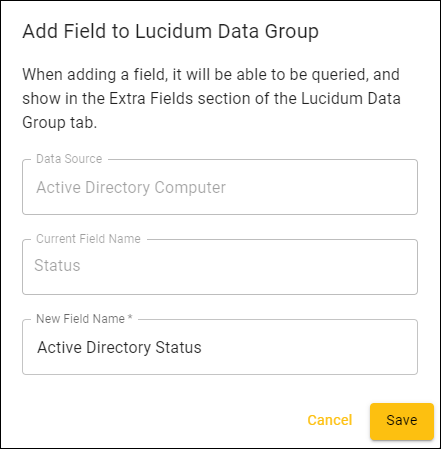
The field now appears in the Lucidum Data Group tab, in the Extra Fields category:
The field now also appears in the Query page, in the Extra Fields category: