Viewing a Dashboard
Viewing a Dashboard
By default, you can view the following types of dashboards:
Dashboards in a channel you are a member of. This includes Lucidum Channels and Team Channels you are a member of or an admin for.
Dashboards you create. For details on creating a dashboard, see the chapter on Creating a Dashboard.
Dashboards that you import via JSON file. For details on exporting and importing dashboards, see the chapter on Exporting and Importing a Dashboard.
Dashboards that have been forwarded to you. For details on forwarding dashboards, see the chapter on Managing a Dashboard.
To view a dashboard:
Log in to your Lucidum system.
In the left menu, click Dashboards.
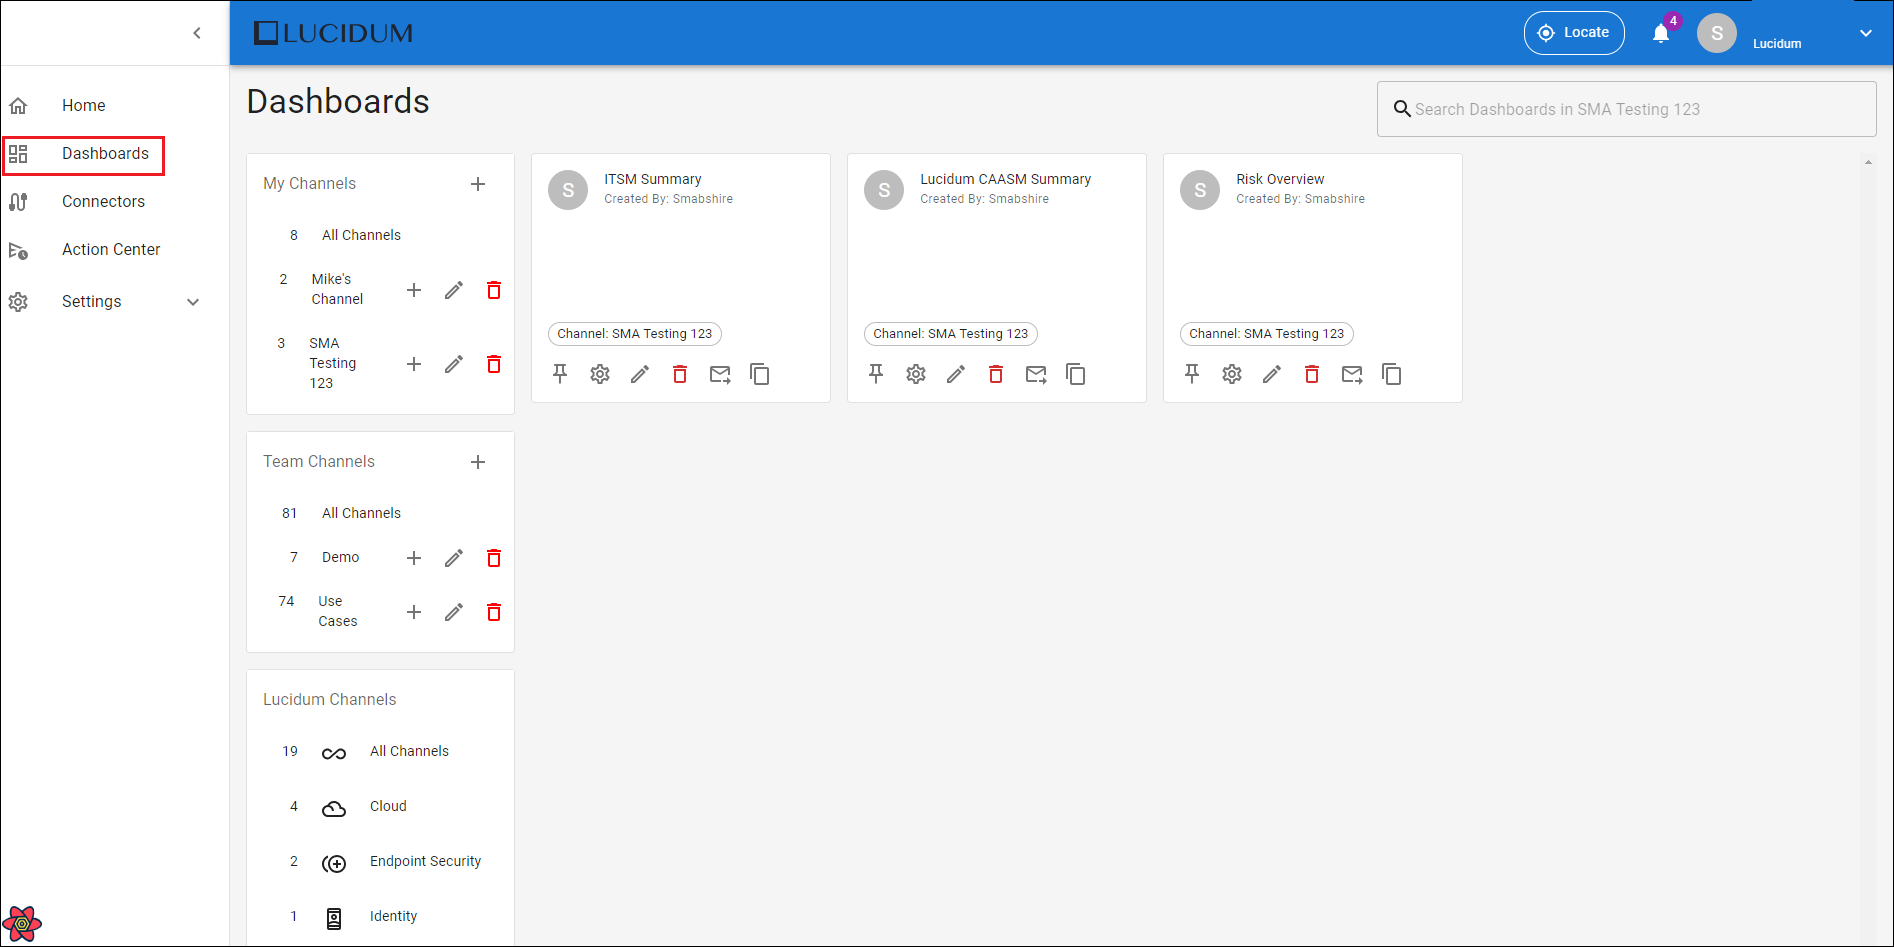
You can search for a dashboard in the Search Dashboards field or click the channel where the dashboard lives (for example, Lucidum Channels > Endpoint Security)
In the list of dashboards in the right pane, click on the name of dashboard you want to view.
Lucidum loads the selected dashboard.
To view another dashboard, repeat these steps.
Elements in a Dashboard Page
Each dashboard page includes the following elements:
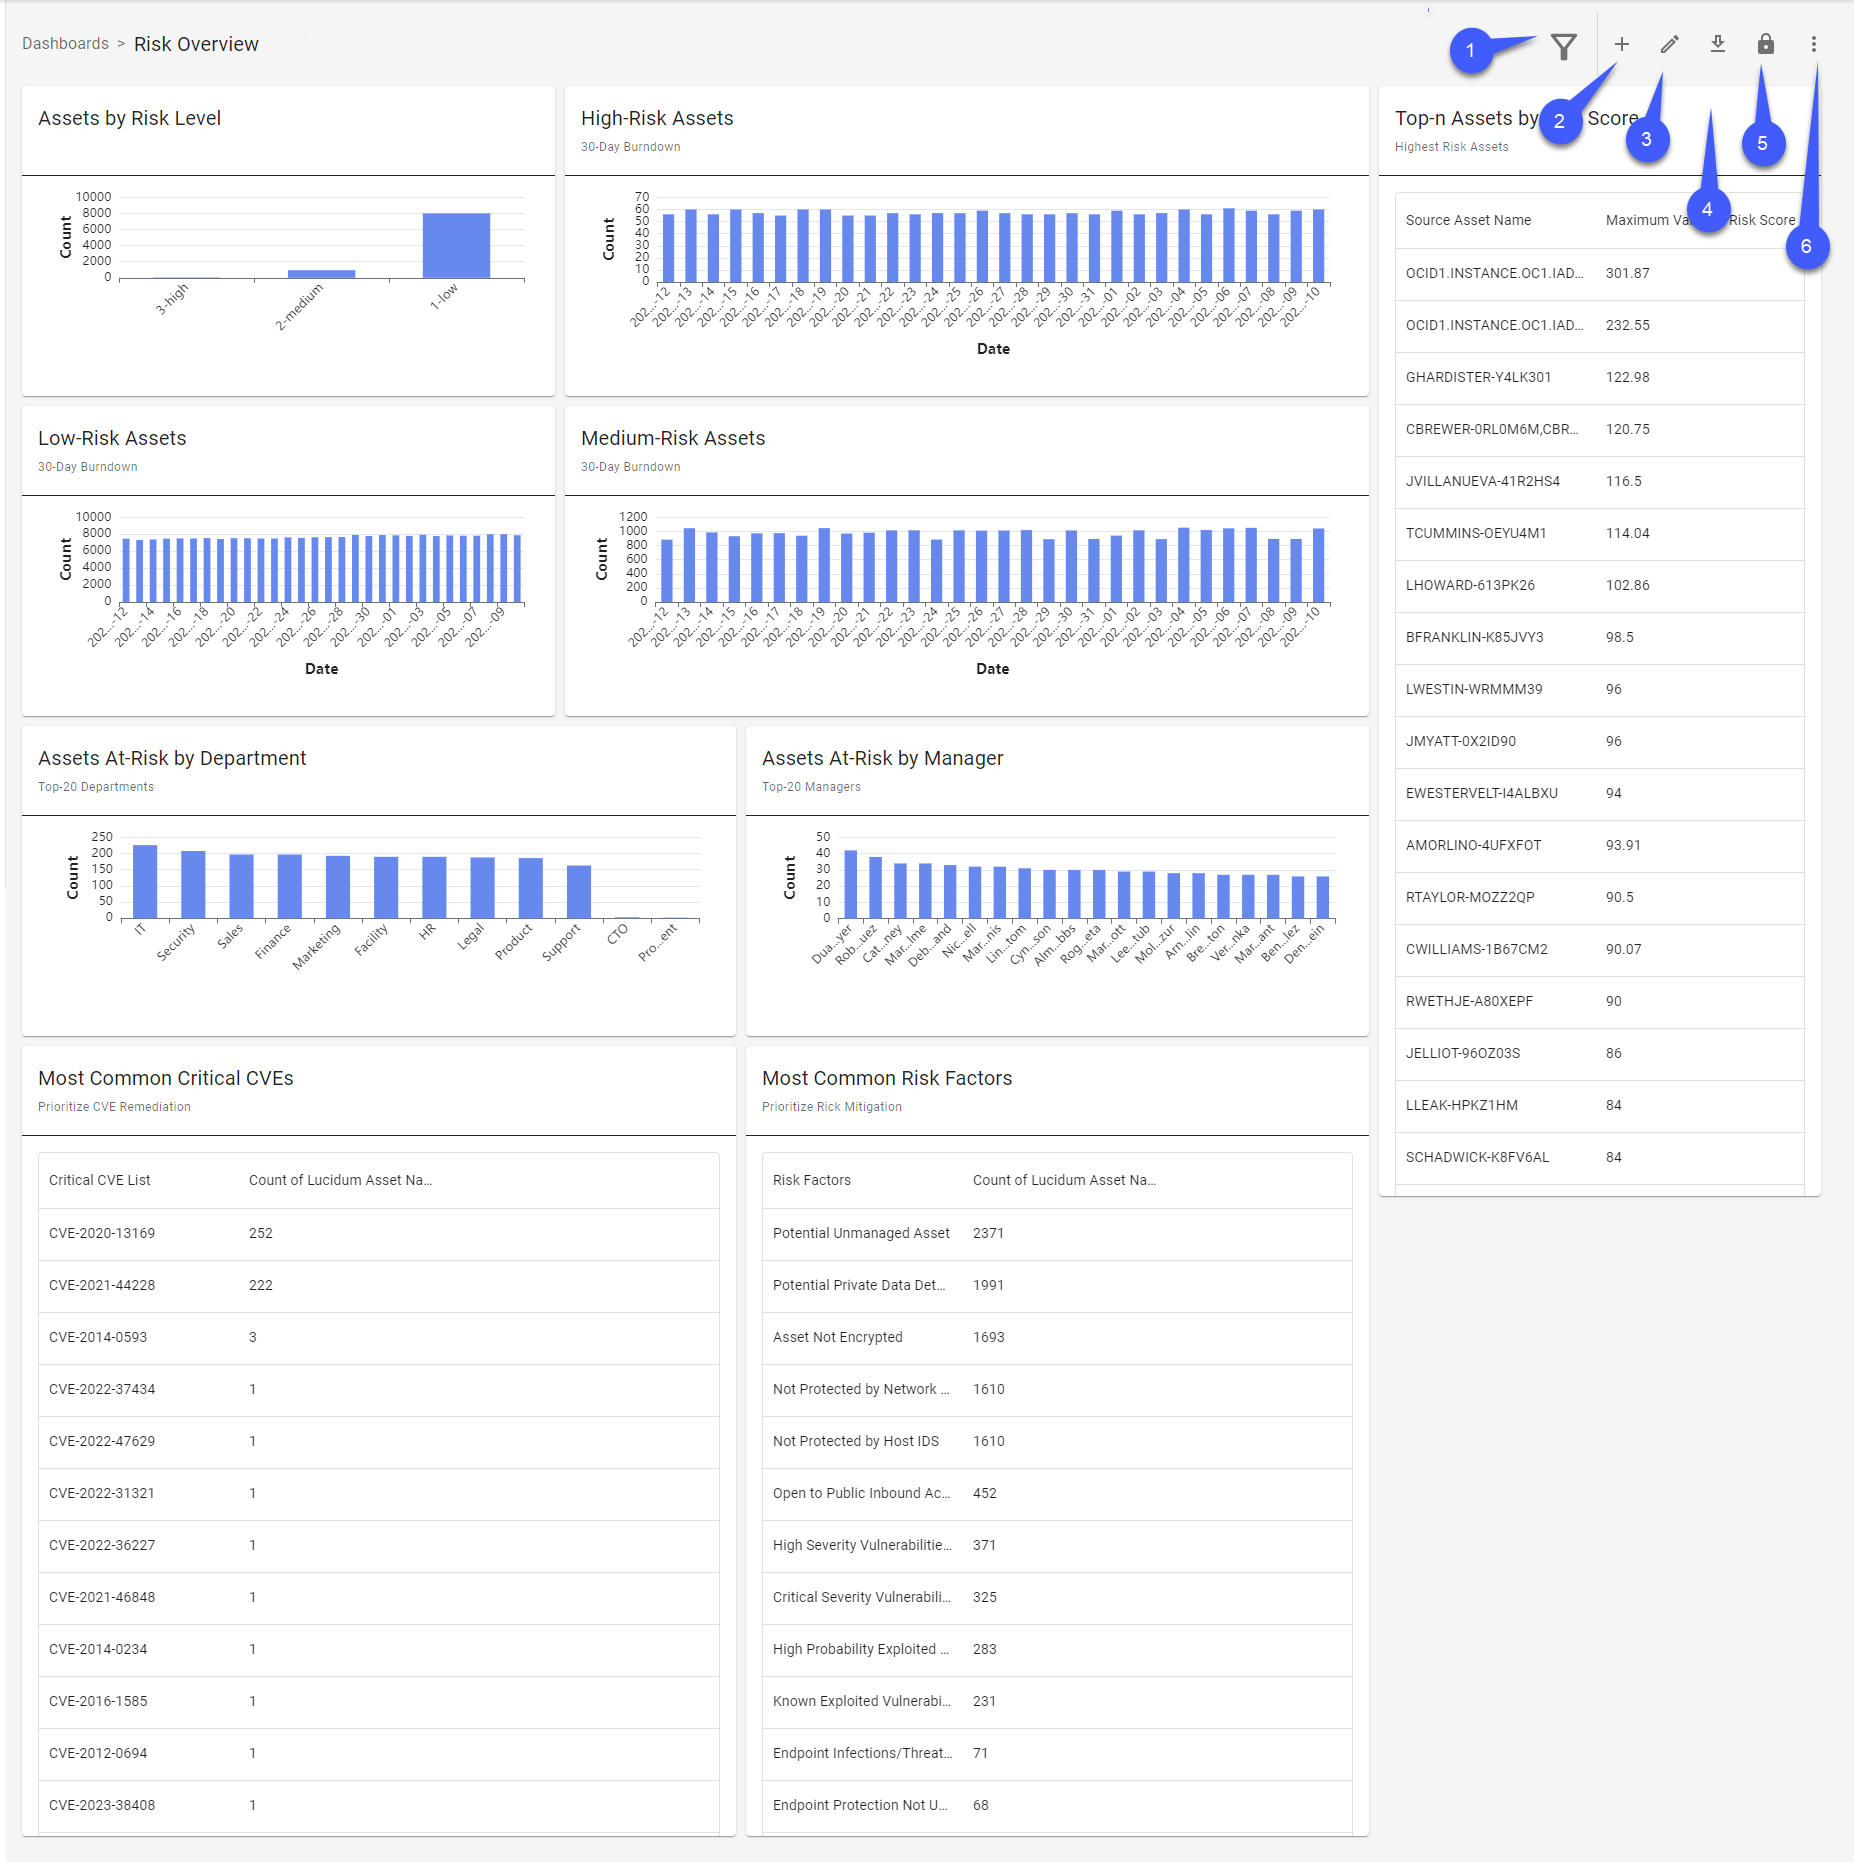
Refine Scope. Opens the Location pane, where you can define a parent query that affects all queries and all charts in the dashboard. For details, see the section on Global Filters.
Add a Chart. Opens the Add Chart dialog, where you can build a new chart for the dashboard. For details, see the chapter on Creating a Chart.
Edit This Dashboard. Enables the editing options for each chart in the dashboard. After making changes, click on the Save This Dashboard icon to save your changes.
Download This Dashboard. Allows you to download the current dashboard as a JSON file or as a PDF file. For details, see Exporting a Dashboard
Modify Chart Layout. Allows you to move and resize charts within the dashboard. Clicking this icon toggles it on (allows changes to layout) and toggles it off (locks layout). For details, see Editing the Layout of a Dashboard.
Menu that includes the following options:
Bulk Clone Charts. Selects all the charts in the current dashboard and creates copies. For details, see the section on Bulk Clone Charts.
Bulk Delete Charts. Deletes all the charts in the current dashboard. For details, see the section on Bulk Delete Charts.
Charts
Charts are the graphical content in a dashboard.
For details on viewing the charts in a dashboard, see Viewing Charts.